

- This event has passed.
[rtec-registration-form event=10712]
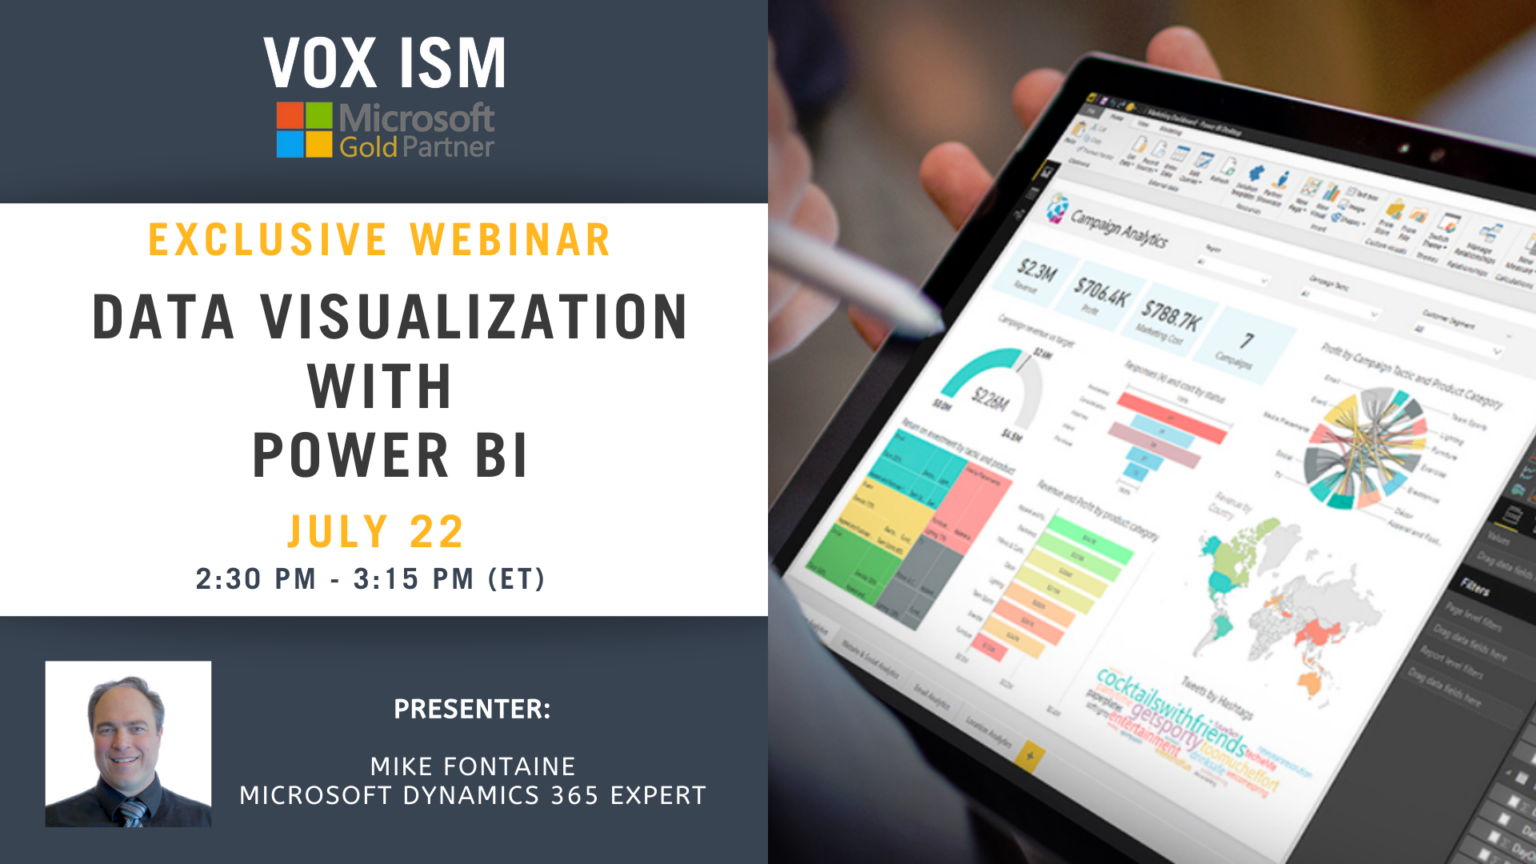
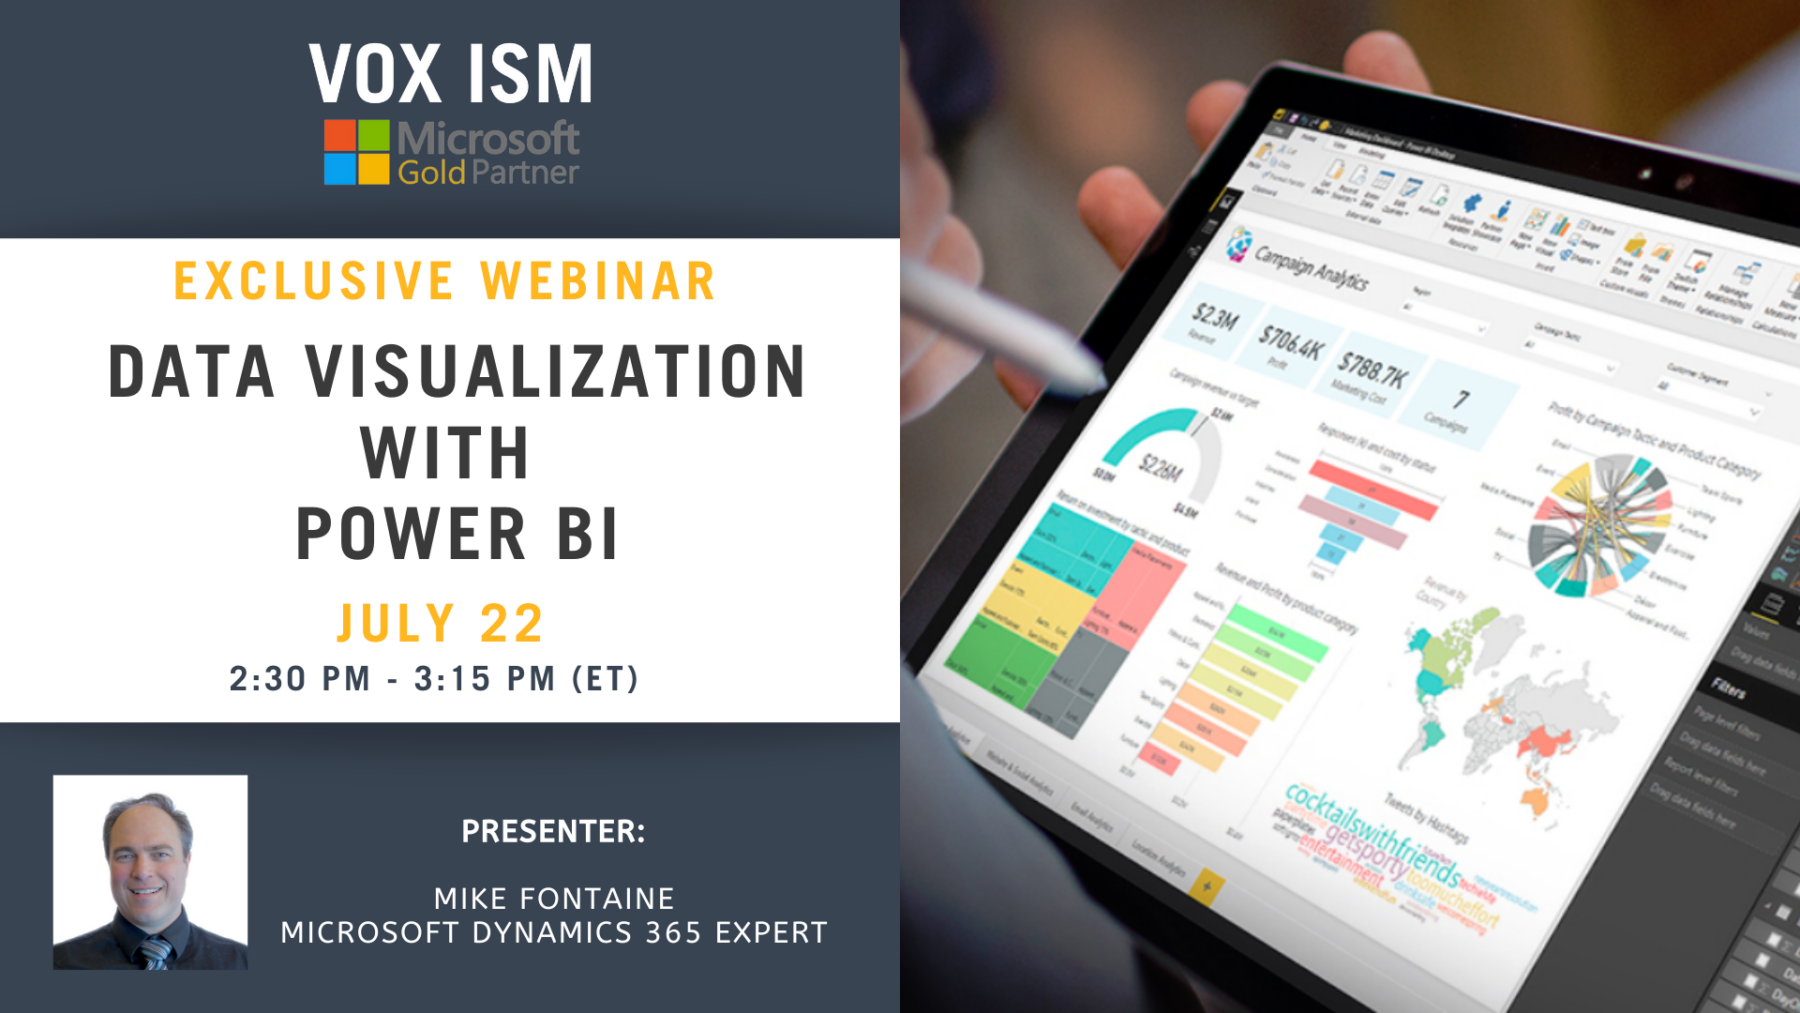
Join us on this exciting webinar to explore how users can discover more significant insights within their data and empower the organization using free options available within Power BI to create dashboards and data visualizations.
The new toolsets from Power BI go beyond the confines of traditional reporting tools with extraordinarily interactive and engaging data visualizations.
In this webinar, we walk you through 10 advanced data visualizations that are native to Power BI. We show you when to use those visualizations and how they can elevate your ability to communicate data insights beyond standard visualizations effectively.
These data visualizations are unique, extremely interactive, and aesthetically stunning. Also, not only are these visualizations look great, but they’re incredibly customizable. You can get a staggering granular control over almost all visual design elements.
The three categories of visualizations we will cover are:
· Relationships – Used to show relationships and connections between data
· Unique Charts – Used to display quantitative analysis along axes visually
· Advanced Tables – Designed for organizing and presenting information
VOX ISM will be hosting 80 training webinars this summer, yes two every day, for your enjoyment and continuing education. Please make us part of your daily summer routine, whether you are working from home or at the office.
If you can’t make it, register now, and we’ll send you a link to the webinar recording once it’s ready.
This webinar will take place on the Cisco Webex platform. Once registered, we will send you the links required to join the Live Webinar.
Hope to see you on the webinar. For questions, reach out to linda@voxism.com, or call 905-840-7477