
Purpose of this presentation: Describe the capabilities and value of Power BI (the service, Power BI Desktop and APIs)
Target audience: Power BI Technical Decision Makers—inclusive of analysts and BI-focused IT professionals
Features
- Receive alerts about important changes in your data
- Share and collaborate with colleagues, and take immediate action
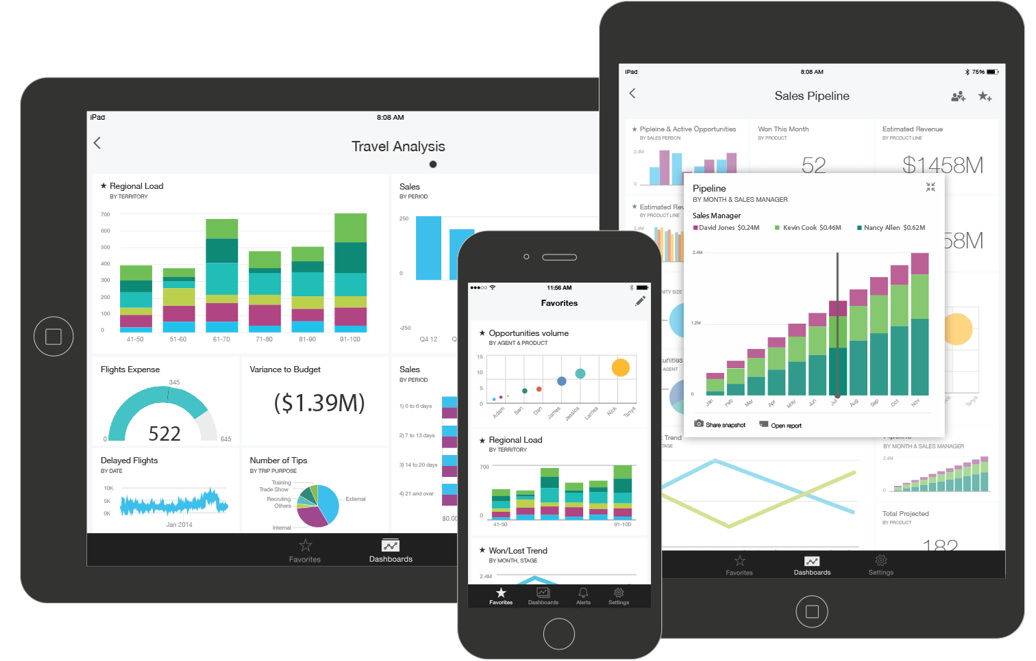
Stay connected from any device
We are working on the next wave of mobile apps for Power BI. These apps will allow users to access their Power BI dashboards through immersive mobile apps for iPad, iPhone, Windows, and Android devices – releasing throughout H1 CY2015. The iPad app is available and found in the Apple store, with the other apps following in the coming months. These apps will also allow users to receive alerts to important changes in their data as well as to share and collaborate with colleagues so that they can take immediate action, from any device.
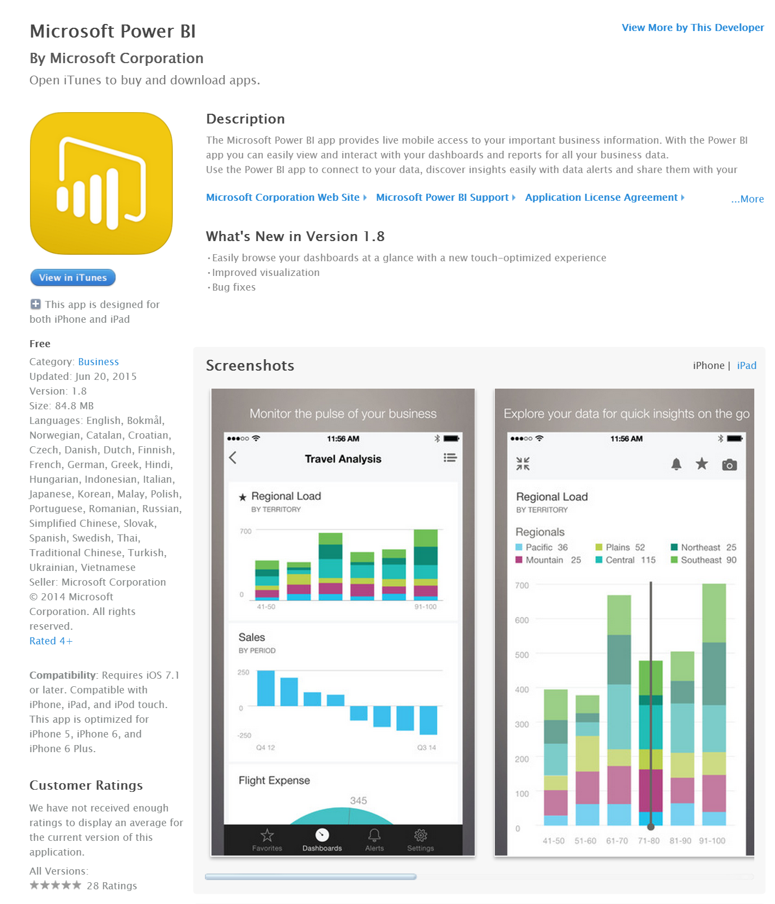
Step 1: Download Apple iPad and iPhone native apps
Microsoft Power BI apps provide live, mobile access to your important business information
- Go to Apple App Store
- Search for Microsoft Power BI apps
- Download and Install Microsoft Power BI apps

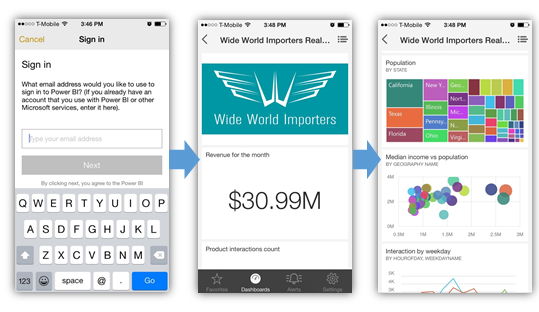
Step 2: Using dashboards in the iPhone app
View dashboards on iPhone
- Open Power BI app on your iPhone and sign in
- Tap Dashboards icon in iPad app for Power BI in bottom bar
- Swipe from side to side to see available Power BI dashboards
- Open dashboard by tapping
- Swipe up and down to see all tiles in dashboard
- Tap back arrow in upper-left corner, or tap Dashboards in bottom bar
Source: https://support.office.com/en-us/article/Dashboards-in-the-iPhone-app-for-Power-BI-preview-0a744ec0-4524-4411-8ebd-7c81dbc99621?ui=en-US&rs=en-US&ad=US
Dashboards are a portal to your company’s life cycle and processes. A dashboard is an overview, a single place to monitor the current state of the business.
You create dashboards in Power BI preview. Power BI also comes with built-in dashboards for some data sources such as Salesforce, and your colleagues can share dashboards with you.
In the iPhone app for Power BI app, you see and can interact with these same dashboards.
View dashboards on your iPhone
Open the Power BI app on your iPhone and sign in.
Tap Dashboards in the bottom bar.
Swipe from side to side to see your available Power BI dashboards.
Tap a dashboard to open it.
Power BI dashboards look a little different on your iPhone. All the tiles appear the same size, and they’re arranged one after another from top to bottom.
Swipe up and down to see all the tiles in the dashboard.
While here, you can:
Tap a tile to open and interact with it.
Tap the Options icon in the upper-right corner to invite a colleague to view your dashboard, or to make some of the dashboard tiles favorites.
Tap the back arrow in the upper-left corner or tap Dashboards in the bottom bar.
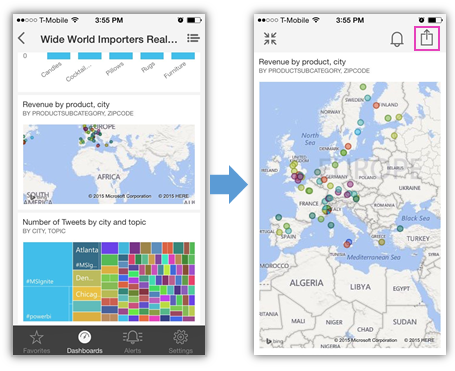
Step 3: Interacting with tiles in the iPhone app
Expand and share tiles
- Tap a tile (it opens in expanded mode, where it’s easier to view and explore tile data)
- Select snapshot icon to share a tile with others
Source: https://support.office.com/en-us/article/Tiles-in-the-iPhone-app-for-Power-BI-preview-2d66d52d-91a1-4d05-b484-c430bc9823d9?ui=en-US&rs=en-US&ad=US
Tiles are live snapshots of your data, pinned to a dashboard. Their values change as the data changes. You create tiles on a dashboard in Power BI preview. Then you see and interact with the tiles in your iPhone app for Power BI.
Interact with tiles on a dashboard
Tap a tile. It opens in an expanded mode, where it’s easier to view and explore the tile data. In this mode you can:
In a line, bar, or column chart, drag the bar to view the values for specific parts of the visualization.
In this line chart, the values of the blue and purple lines are listed under the month, April, where the vertical bar intersects them.
In a pie chart, spin the pie to show the values of the slice at the top of the pie.
Tap the snapshot icon to share a tile with others.
Tap the close icon to close the tile and return to the dashboard.
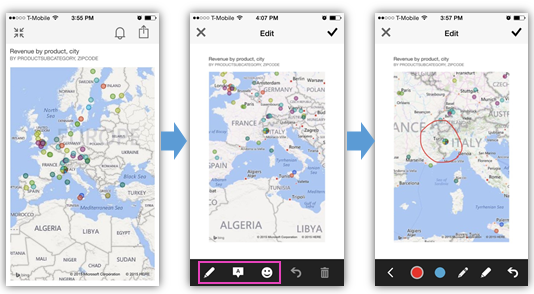
Step 4: Annotate charts and share
Mark up your charts for sharing insights with others
- Click on Snapshot icon
- Click pencil to draw on chart
- Click annotate icon to type text on the chart
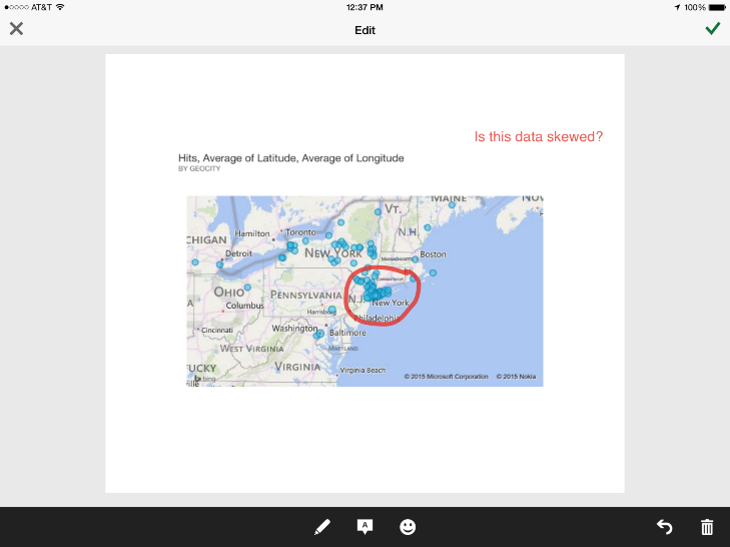
Annotations on iPad
Annotations experience on iPad is similar to the iPhone experience
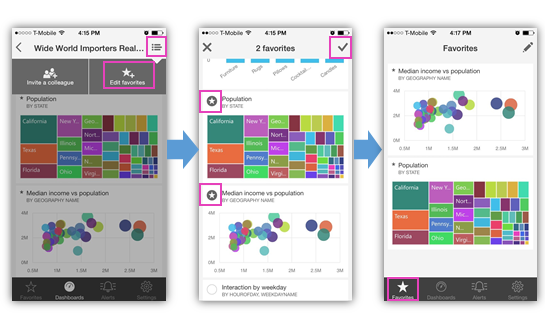
Step 5: Setting favorites in the iPhone app
Bookmarking and viewing favorite tiles
- Easily access your most interesting data
- Create, view, and remove favorites
Source: https://support.office.com/en-us/article/Favorites-in-the-iPhone-app-for-Power-BI-preview-05b8277a-df8a-46b3-9fa5-0db785266a22?ui=en-US&rs=en-US&ad=US
For easy access to your most interesting data, you can mark specific tiles as favorites on your iPhone. Only you can see your Favorites dashboard, which brings your favorite tiles from all of your dashboards together in one place.
Note You can’t see your iPhone favorites on your iPad, and vice versa.
Create favorites
In your dashboard in the iPhone app, tap the Options icon > tap Add to favorites.
Tap the circles in the upper-right corner of the tiles you want on your Favorites page.
Each favorite tile now has a star in its upper-left corner.
Tap the check mark in the upper-right corner when you’ve selected all the favorites you want.
View your favorites
Tap Favorites in the bar at the bottom of the app.
Your favorites from all your dashboards are on this one page.
Remove favorites
On the Favorites page, tap the pencil in the upper-right corner and clear the stars from the tiles you don’t want as favorites.
Note Removing a favorite doesn’t remove the tile from the dashboard, or the chart from the report. It’s just no longer a favorite.
Tap the check mark in the upper-right corner when you’ve finished.
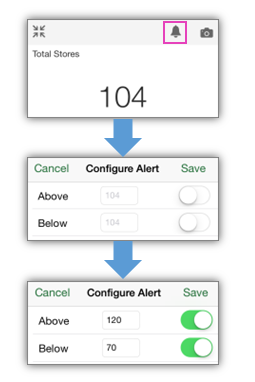
Step 6: Creating data alerts in the iPhone app
Set up data alerts
- Use alerts for tiles featuring single numbers (refreshed daily)
- Tap a number tile in dashboard to open
- Select bell icon to add alert
- Type numbers to receive alerts above or below those values, or both
- Tap Save
Source: https://support.office.com/en-us/article/Create-data-alerts-in-the-iPhone-app-for-Power-BI-preview-f314ce0e-a463-4875-997a-6cd25ba3500b?ui=en-US&rs=en-US&ad=US
In the iPhone app for Microsoft Power BI, you set alerts to notify you when data in your dashboards changes beyond limits you set. Alerts work for tiles featuring a single number. Only you can see the data alerts you set, even if you share a dashboard or a snapshot of a tile.
Tap a number tile in dashboard to open it.
Tap the bell icon to add an alert.
Type numbers to receive alerts above or below those values, or both.
Tap Save.
Data sources are often set to refresh daily, although someone can manually refresh them. When the data in the dashboard is refreshed, you’ll receive an alert if the new value is above or below the number you set.
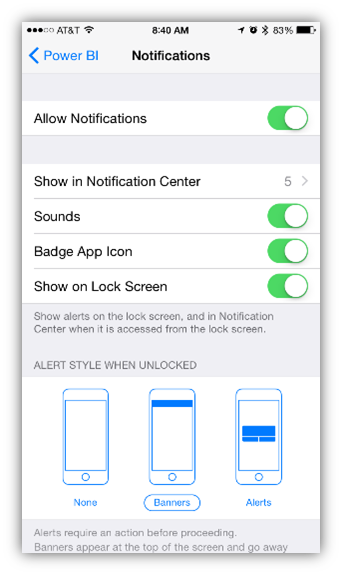
Step 7: Configure notifications for iPhone
Control notifications for Power BI app by adjusting iPhone settings
References
https://support.powerbi.com/knowledgebase/topics/78002-iphone-app-power-bi-for-ios-previewhttps://support.powerbi.com/knowledgebase/articles/527063-set-data-alerts-in-the-iphone-app-power-bi-for-iohttps://support.powerbi.com/knowledgebase/topics/77999-ipad-app-power-bi-for-ios-preview