
How to Create Your First Power BI Dashboard
Kickstart your data journey with our “Power BI Dashboards” webinar! In this interactive session, you’ll learn how to harness the full potential of Power BI to transform raw data into insightful, actionable dashboards. Whether you’re new to Power BI or looking to sharpen your skills, this workshop will walk you through essential concepts, hands-on demonstrations, and best practices to help you build and deploy impactful business dashboards efficiently.
• Introduction to Power BI and dashboard concepts
• Connecting and preparing data sources
• Designing interactive reports and visualizations
• Implementing data models and DAX formulas
• Sharing dashboards securely across your organization
• Tips for optimizing dashboard performance and usability

How to Create Your First Power BI Dashboard
Kickstart your data journey with our “Power BI Dashboards” webinar! In this interactive session, you’ll learn how to harness the full potential of Power BI to transform raw data into insightful, actionable dashboards. Whether you’re new to Power BI or looking to sharpen your skills, this workshop will walk you through essential concepts, hands-on demonstrations, and best practices to help you build and deploy impactful business dashboards efficiently.
· Introduction to Power BI and dashboard concepts
· Connecting and preparing data sources
· Designing interactive reports and visualizations
· Implementing data models and DAX formulas
· Sharing dashboards securely across your organization
· Tips for optimizing dashboard performance and usability
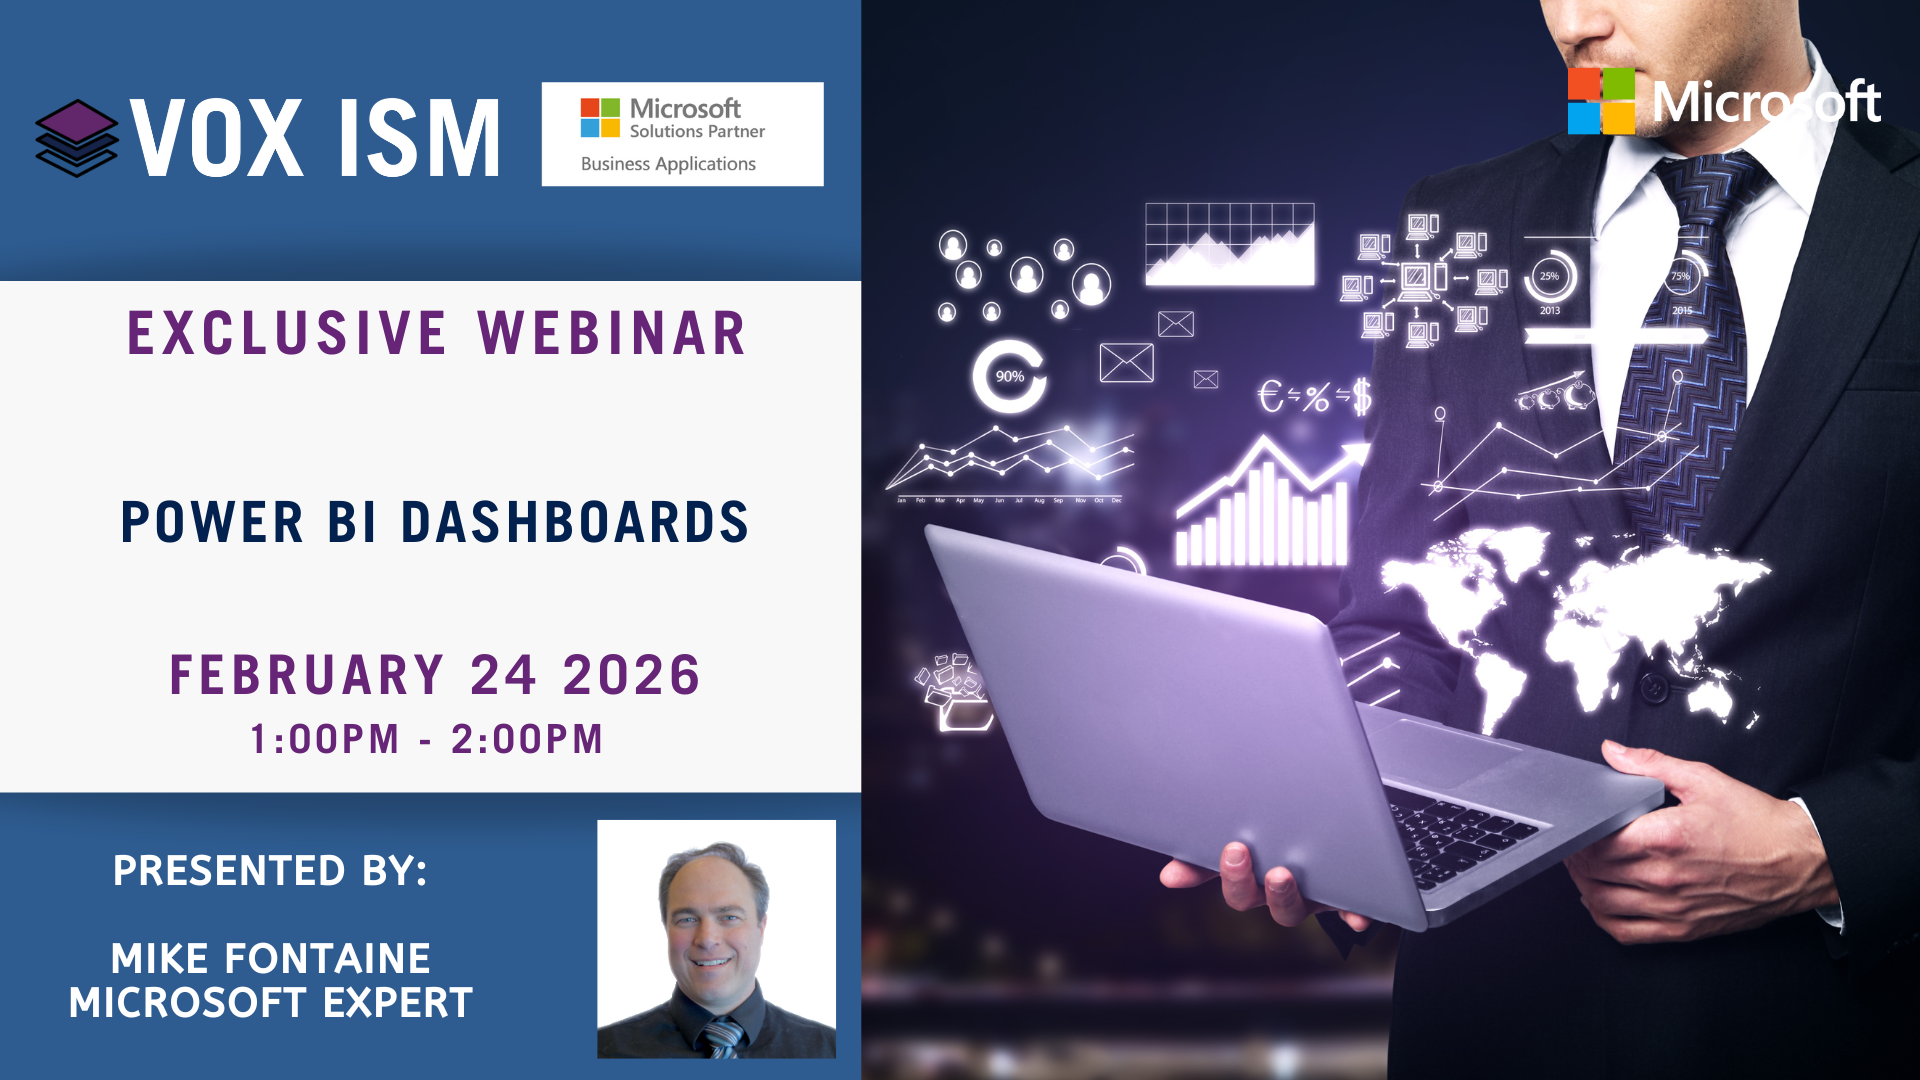
Power BI Dashboards
Kickstart your data journey with our “Power BI Dashboards” webinar! In this interactive session, you’ll learn how to harness the full potential of Power BI to transform raw data into insightful, actionable dashboards. Whether you’re new to Power BI or looking to sharpen your skills, this workshop will walk you through essential concepts, hands-on demonstrations, and best practices to help you build and deploy impactful business dashboards efficiently.
· Introduction to Power BI and dashboard concepts
· Connecting and preparing data sources
· Designing interactive reports and visualizations
· Implementing data models and DAX formulas
· Sharing dashboards securely across your organization
· Tips for optimizing dashboard performance and usability

Power BI Dashboard in a Day
Kickstart your data journey with our “Power BI Dashboard in a Day” webinar! In this interactive session, you’ll learn how to harness the full potential of Power BI to transform raw data into insightful, actionable dashboards. Whether you’re new to Power BI or looking to sharpen your skills, this workshop will walk you through essential concepts, hands-on demonstrations, and best practices to help you build and deploy impactful business dashboards efficiently.
· Introduction to Power BI and dashboard concepts
· Connecting and preparing data sources
· Designing interactive reports and visualizations
· Implementing data models and DAX formulas
· Sharing dashboards securely across your organization
· Tips for optimizing dashboard performance and usability

Power BI for the Pro's, a Master Class
This training covers key Power BI skills to help you create advanced reports Providing training on data analysis, data transformation, and visualization.
· Learn the complete workflow in Power BI from A to Z
· Advanced analytics with DAX - calculated columns & measures
· All-in-One: Power BI Desktop, Power BI Cloud & Power BI Mobile!
· Learn how to design and implement professional reports
· Learn storytelling with data to visualize your data effectively
· Advanced features such as working with parameters, using R scripts, optimizing performance and
· Row-Level Security
· Performance optimizing
· Python & R in Power BI
· Forecasting & advanced analytics
· Time intelligence
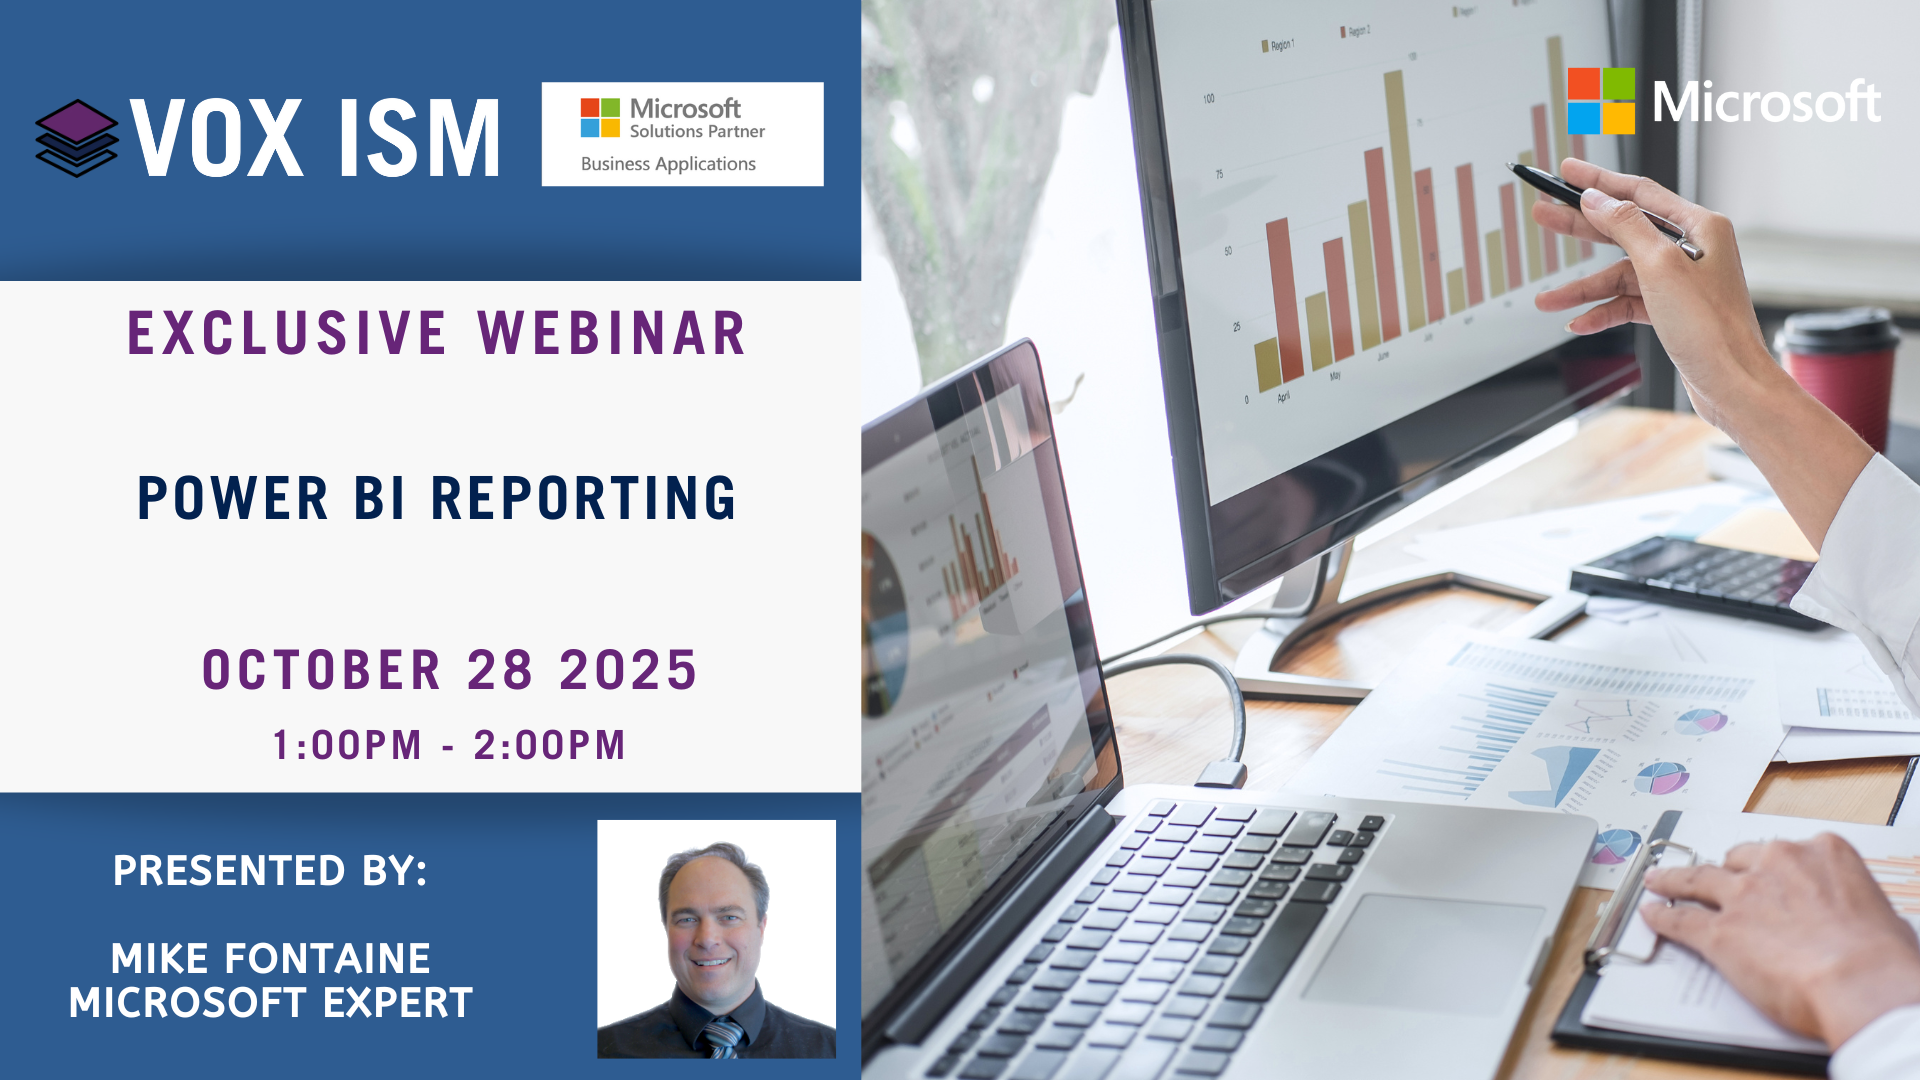
Power BI Reporting
This session introduces Power BI reporting, focusing on transforming data into actionable insights through interactive dashboards and visual analytics.
What we’ll cover:
· Overview of Power BI and its role in business intelligence
· Connecting to datasets and building data models
· Creating visualizations and interactive reports
· Combining tables and managing relationships
· Filters, slicers, and drill-throughs for dynamic insights
· Best practices for report design and usability
· Sharing, collaboration, and governance

Power BI Dashboard in a Day
This session provides a hands-on introduction to Power BI, designed for those who want to quickly learn the essentials without committing to a full-day workshop. Participants will walk away with the skills to connect data, build visuals, and design an interactive dashboard.
What we’ll cover:
· Introduction to Power BI – What it is and how it fits into Microsoft 365
· Datasets – Importing, cleaning, and shaping data
· Connecting Tables – Building relationships and understanding the data model
· Visualizations – Choosing the right visuals for the story
· Interactivity – Filters, slicers, and drill-throughs
· Designing a Dashboard – Layout, usability, and best practices
· Sharing & Collaboration – Publishing dashboards and working with others
· Next Steps – Learning paths and advanced capabilities to explore

Power BI 101 Training
Agenda
· Introduction to Power BI and Business Central
· Installation and Configuration of Power BI Reports
· Modifying Reports in Power BI Desktop
· Displaying Customized Reports in the Application
Training Overview
· Basics of Power BI and its integration with Business Central
· Step-by-step installation and configuration of 66 new Power BI reports from Microsoft
· Downloading and connecting Power BI reports to Business Central
· Configuring data sources and refreshing data
· Understanding the Power BI Desktop interface
· Editing and creating visualizations
· Applying filters and slicers
· Saving and publishing reports
· Embedding Power BI reports in Business Central
· Setting up dashboards and sharing with the team
We look forward to guiding you through this comprehensive training session and helping you make the most of Power BI in your Business Central environment.

CFO Insights, Financial Reporting and Dashboards
CFOs today are stuck wasting time wrestling data out of outdated systems, manually updating spreadsheets, and working without real-time visibility. The result? Delayed decisions, missed opportunities, and no clear path to scale. Join us for “Financial Reporting for CFOs” and see how Microsoft Dynamics 365 Business Central gives finance leaders the tools they need to move from reactive reporting to strategic insight — fast.
Agenda
· Introduction to Business Central
- Real-time visibility
- Integrated Accounting
- Faster Month-End Close
- Scenario Planning and Forecasting
· Financial dashboards – 69 new Power BI Dashboards
· Trial balance / P&L drilldowns
· Budgeting and forecasting tools
· Export to Excel and Power BI integration
· Tariffs update
· Microsoft Copilot, saves 30% of your accounting time in 2025

Power BI 101 Training
Agenda
· Introduction to Power BI and Business Central
· Installation and Configuration of Power BI Reports
· Modifying Reports in Power BI Desktop
· Displaying Customized Reports in the Application
Training Overview
· Basics of Power BI and its integration with Business Central
· Step-by-step installation and configuration of 66 new Power BI reports from Microsoft
· Downloading and connecting Power BI reports to Business Central
· Configuring data sources and refreshing data
· Understanding the Power BI Desktop interface
· Editing and creating visualizations
· Applying filters and slicers
· Saving and publishing reports
· Embedding Power BI reports in Business Central
· Setting up dashboards and sharing with the team
We look forward to guiding you through this comprehensive training session and helping you make the most of Power BI in your Business Central environment.