
- This event has passed.
Hey! Did you sign up for the Power BI 201 course but didn’t take our 101?
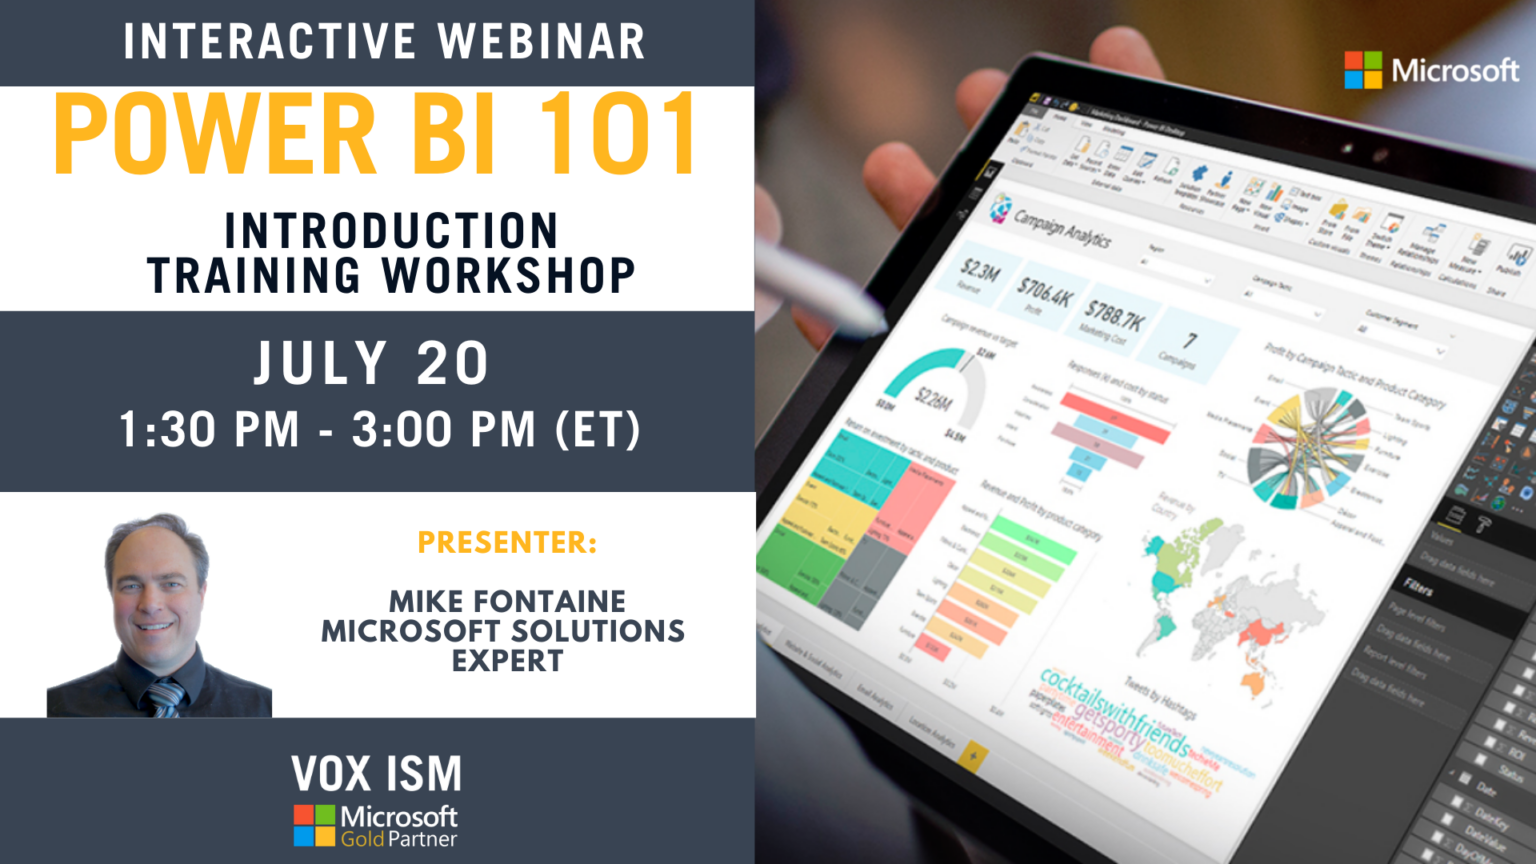
Better, sign up for this event to get you ready and prepared for the 201 course. In this webinar, we will give you a crash course on how to create dashboards and visualizations using Power BI in 90 minutes.
Webinar Agenda:
1. Training on report layouts, visualization, tools, filters and navigation
2. Creating your first Dashboard in Power BI
Prerequisites:
1. You should have a laptop.
2. Download Power BI to your desktop/laptop
3. We will email you the training database
Deliverable:
At the end of the webinar, each person will have created Power BI – Dashboard with graphs and slicers
Why this training?
- You can learn at your desk with our sample datasets, with easy to follow instructions using the free version of Power BI desktop.
- Participants will receive the recorded version of the webinar in addition to the training PowerPoint.
How will it benefit me?
- Understanding the trends and outliers in your business can aid in making informed decisions that can result in success.
- Turning data into knowledge that can help drive your business, providing insights for better business decisions.
- Time Analysis is significantly easier when using a tool like Power BI.
What are the objectives of the training series?
- Upon completion, learners will be ready to model data and build amazing analytics in real-world scenarios, such as analytics on sales data, financial data, or manufacturing or distribution data.
This webinar will take place on the Cisco Webex platform. Once registered, we will send you the links required to join the Live Webinar.
Hope to see you at the webinar. For questions, reach out to linda@voxism.com, or call 705-466-7477.
