Improving OEE – Overall equipment effectiveness
From Wikipedia, the free encyclopedia Overall equipment effectiveness (OEE) is a term coined by Seiichi Nakajima in the 1960s to evaluate how effectively a manufacturing operation is utilized.
Overall equipment effectiveness has been around a very long time, since the 1960’s. It was designed as a tool to measure performance in a manufacturing plant. It suppose to give you a bird’s eye perspective on how well the factory’s assets are performing and recently this term has been getting a lot of hype on the internet. Here is a well written perspective on OEE.
Recently I created a business intelligence cube for Microsoft Dynamics for OEE.
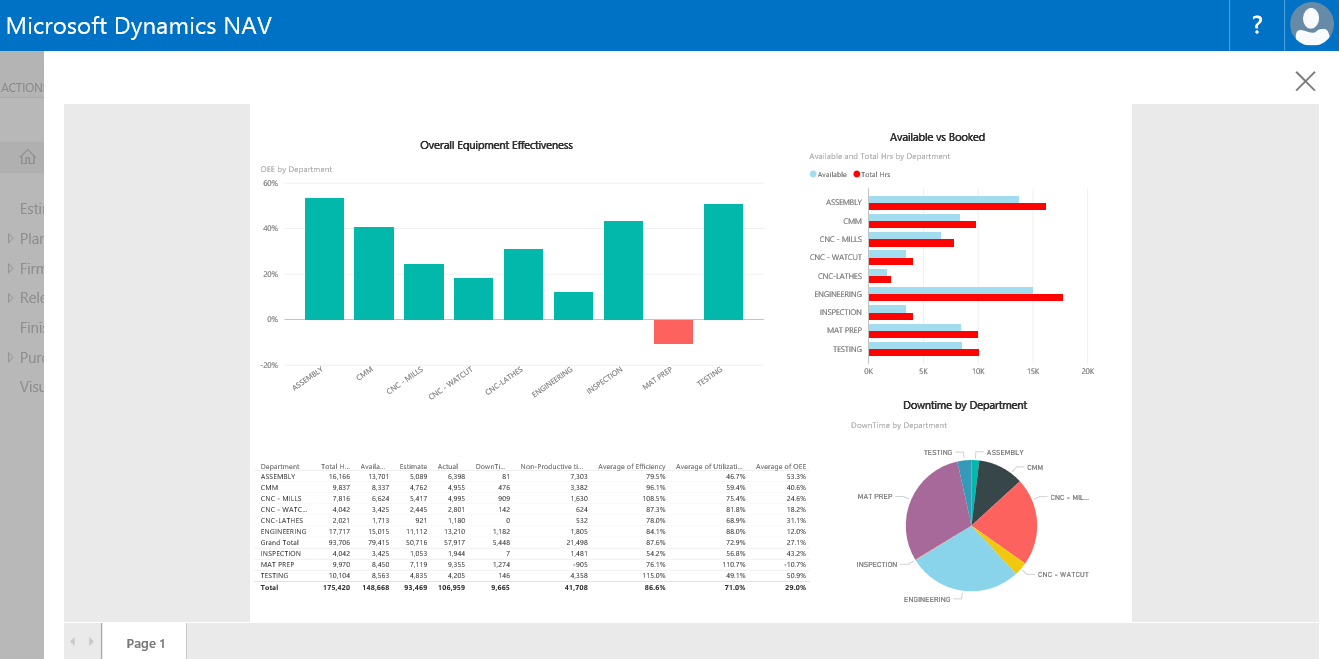
I then created a Power BI dashboard so that it could be displayed more graphically and be deployed to phones. The first large improvement was the ability to drill down or expand down to the work order, part, number of pieces and operation. This allows the user to see graphically a problem and dig deeper into the problem. The second improvement was that I can set an alert through Power BI and plant managers can get an email or text message when something goes wrong. But after creating this report and starting to use it in manufacturing companies I realize that there are problems with report overall.
-
- In the calculation of OEE both utilization and efficiency are weighted equally; but think about, it what’s worse for manufacturing a machine that is completely stopped or a machine/person that is performing slower than expected.
- It has no bearing on the throughput or revenue of the shop; meaning a plant manager who is compensated by these numbers can be building parts to inventory to make the numbers look good.
- OEE is suppose to equalize machines that run at different rates. This is OK if you have an automotive assembly plant, but if you own a job shop it is very misleading because different work centers have VERY different rates (think saw-cutting vs welding).
- OEE lacks any consideration for maintenance or preventative maintenance. More specifically maintenance reflects poorly in the equations and would lead to a plant manager to NOT maintain equipment in order to better manipulate the numbers.
At the end of the day the real value of this report is that it should provide you with enough information that you can start to can insights into performance issues through the use of slicers.
-
- When do I run into more troubles – day shift or night shift?
- Are some product groups performing better than others?
- Which customers or customer parts have the most trouble?
- Are my standards correct?
- Am I having a reporting issue on the shop floor?
Dynamics 365 & Office 365 Working Together – Free Event
I will be showcasing Power BI on May 17th at the Cambridge Holiday Inn. Sign up here if you’d like to learn more.
https://voxism.com/webinars/office-365-and-dynamics-365-working-together-cambridge-event/
by Mike Fontaine
Manufacturing and Distribution On-Boarding Expert
mfontaine@voxism.com
LinkedIn