
Microsoft for Manufacturing 2017: NAV, CRM, Office 365 - Sept. 28 Seminar
A digital office feeds the business’ appetite for disruption innovation. But the limitation and challenge is the existing information, technology systems and infrastructure.
New ways of working and thinking are required to see collaborative engagement instead of functional pockets of knowledge. Initiatives like replacing servers and IT staff with cloud infrastructure and managed services. This allows the organization to better focus on using systems instead of maintaining them. Other initiatives to allow for collaborating on shared documents in the cloud instead of emailing attachments for someone to revise. Digital services like OCR can boost productivity and younger employees can show the mature staff how to make better use the digital tools and new applications.
Welcome to the new world of Microsoft for Manufacturing 2017. At Vox ISM we put the needs of Canadian Manufacturing first, focusing on relevance and productivity and leveraging the Microsoft technology second.
Agenda
- 1:30pm An Introduction to 2017
- Microsoft Dynamics 365 ERP
- Microsoft Dynamics 365 CRM
- Office 365 Integration
- Mobility
- Power BI and Cortana Intelligence
- 2:00pm Software Configured for Manufacturers and Distributors
- 5 Levels of Scheduling
- Time Tracking 7 Shop Data Collection
- Machine Integration
- Configurator
- Business Intelligence and Management Reporting
- Industry Specific Apps
- 3:00pm Government Grants, Funding and Implementation Tools
- COJG Funding
- Customer Portals
- ISO Implementation Tools and Techniques
Improving OEE Metrics - with Microsoft Dynamics and Power BI
Improving OEE - Overall equipment effectiveness
From Wikipedia, the free encyclopedia Overall equipment effectiveness (OEE) is a term coined by Seiichi Nakajima in the 1960s to evaluate how effectively a manufacturing operation is utilized.
Overall equipment effectiveness has been around a very long time, since the 1960's. It was designed as a tool to measure performance in a manufacturing plant. It suppose to give you a bird's eye perspective on how well the factory's assets are performing and recently this term has been getting a lot of hype on the internet. Here is a well written perspective on OEE.
Recently I created a business intelligence cube for Microsoft Dynamics for OEE.
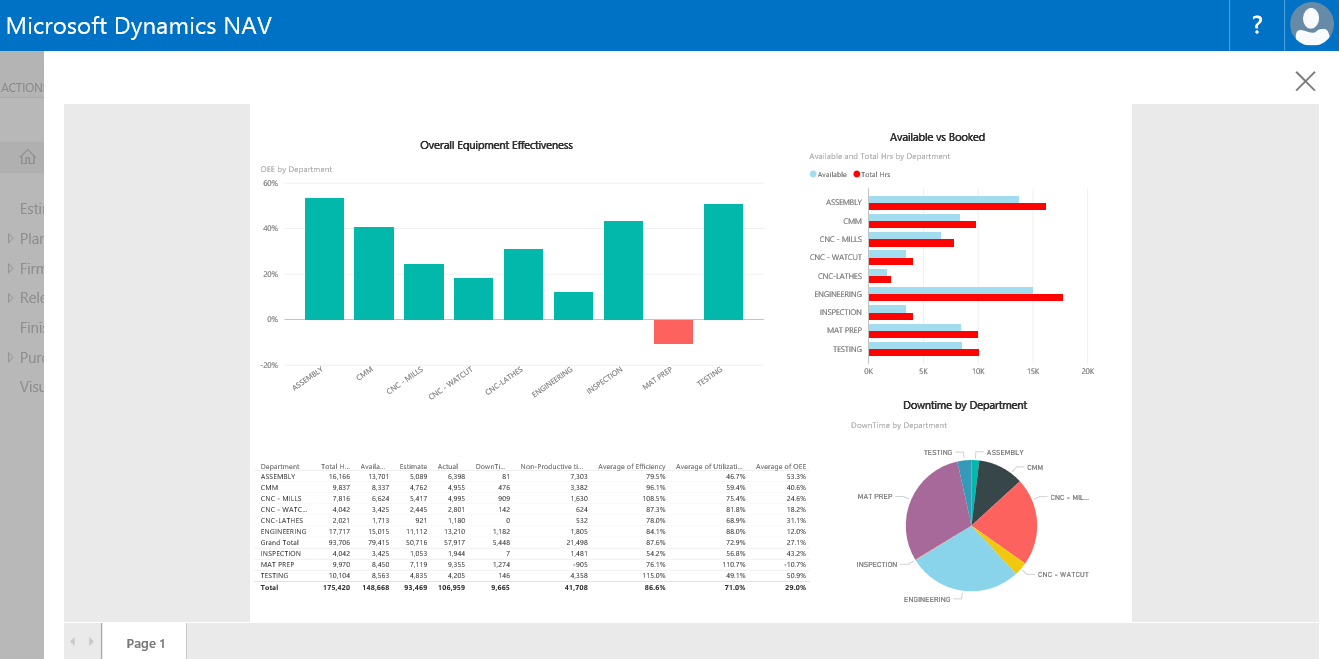
I then created a Power BI dashboard so that it could be displayed more graphically and be deployed to phones. The first large improvement was the ability to drill down or expand down to the work order, part, number of pieces and operation. This allows the user to see graphically a problem and dig deeper into the problem. The second improvement was that I can set an alert through Power BI and plant managers can get an email or text message when something goes wrong. But after creating this report and starting to use it in manufacturing companies I realize that there are problems with report overall.
-
- In the calculation of OEE both utilization and efficiency are weighted equally; but think about, it what's worse for manufacturing a machine that is completely stopped or a machine/person that is performing slower than expected.
- It has no bearing on the throughput or revenue of the shop; meaning a plant manager who is compensated by these numbers can be building parts to inventory to make the numbers look good.
- OEE is suppose to equalize machines that run at different rates. This is OK if you have an automotive assembly plant, but if you own a job shop it is very misleading because different work centers have VERY different rates (think saw-cutting vs welding).
- OEE lacks any consideration for maintenance or preventative maintenance. More specifically maintenance reflects poorly in the equations and would lead to a plant manager to NOT maintain equipment in order to better manipulate the numbers.
At the end of the day the real value of this report is that it should provide you with enough information that you can start to can insights into performance issues through the use of slicers.
-
- When do I run into more troubles - day shift or night shift?
- Are some product groups performing better than others?
- Which customers or customer parts have the most trouble?
- Are my standards correct?
- Am I having a reporting issue on the shop floor?
Dynamics 365 & Office 365 Working Together - Free Event
I will be showcasing Power BI on May 17th at the Cambridge Holiday Inn. Sign up here if you'd like to learn more.
https://voxism.com/webinars/office-365-and-dynamics-365-working-together-cambridge-event/
by Mike Fontaine
Manufacturing and Distribution On-Boarding Expert
mfontaine@voxism.com
LinkedIn
Microsoft Dyn365 NAV 2017 - It's all about the Role Centre
NAV 2017 – Its all about the Role Centre
As businesses grow it becomes more and more difficult to leverage your technology and manage your people. Not with Microsoft Dynamics 365 and NAV 2017. Now in NAV 2017 with Power BI there are two new features that make everyone’s favourite landing page, the Role Center, even more powerful than before. With the ability to embed Power BI and create your own Chart Parts you will have the power to see across your organization’s KPI’s and at the same time visually see how your employees are performing.
Power BI Embedded in your NAV 2017 Dashboard – KPI’s at your fingertips
Microsoft’s incredible Business Intelligence suite Power BI is now embedded in NAV 2017. This means that all the stunning visuals that you create in Power BI are now available within your business system. With the ability to connect to 60 different data sources, including our favourites Dynamics 365, SQL Server, Microsoft NAV and of course Excel
...and displayed in your NAV dashboard
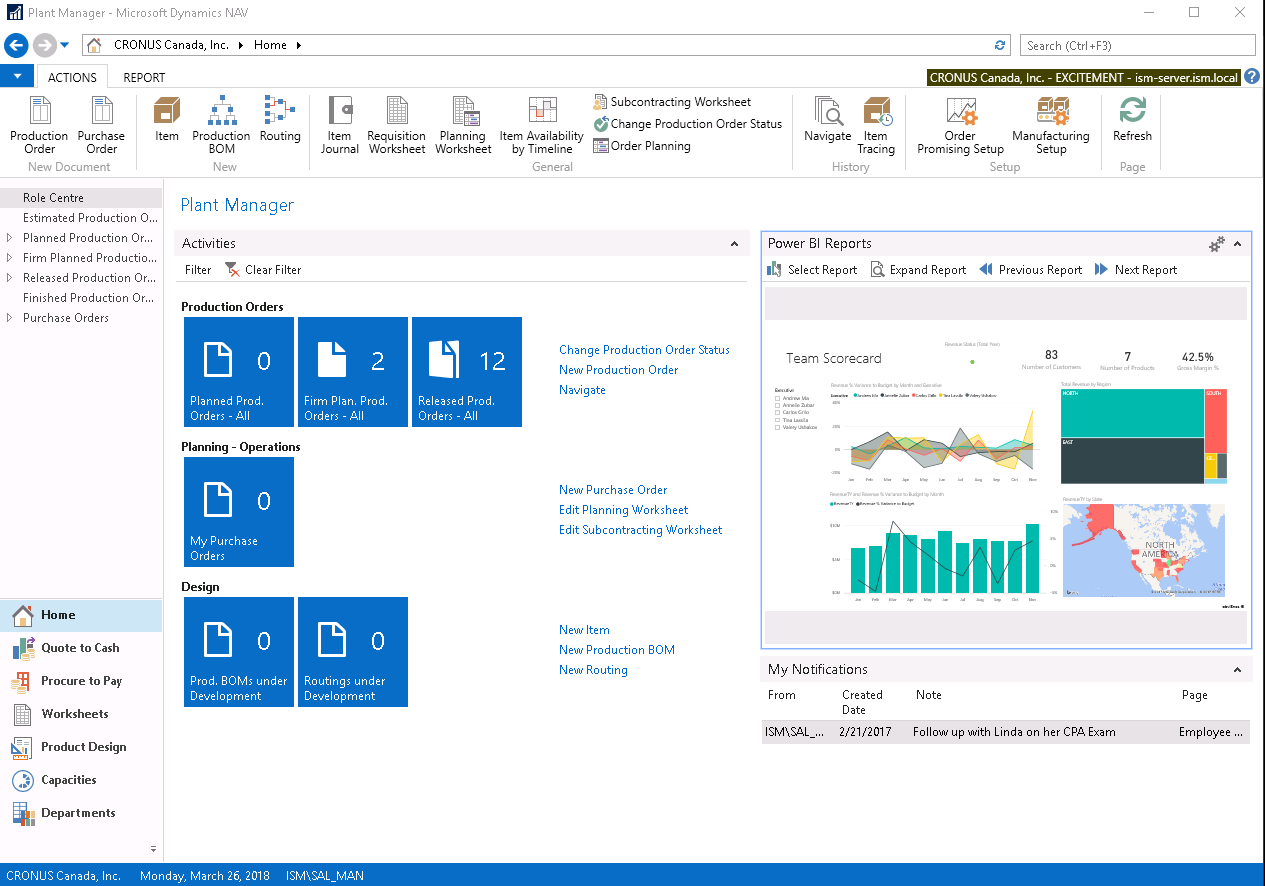
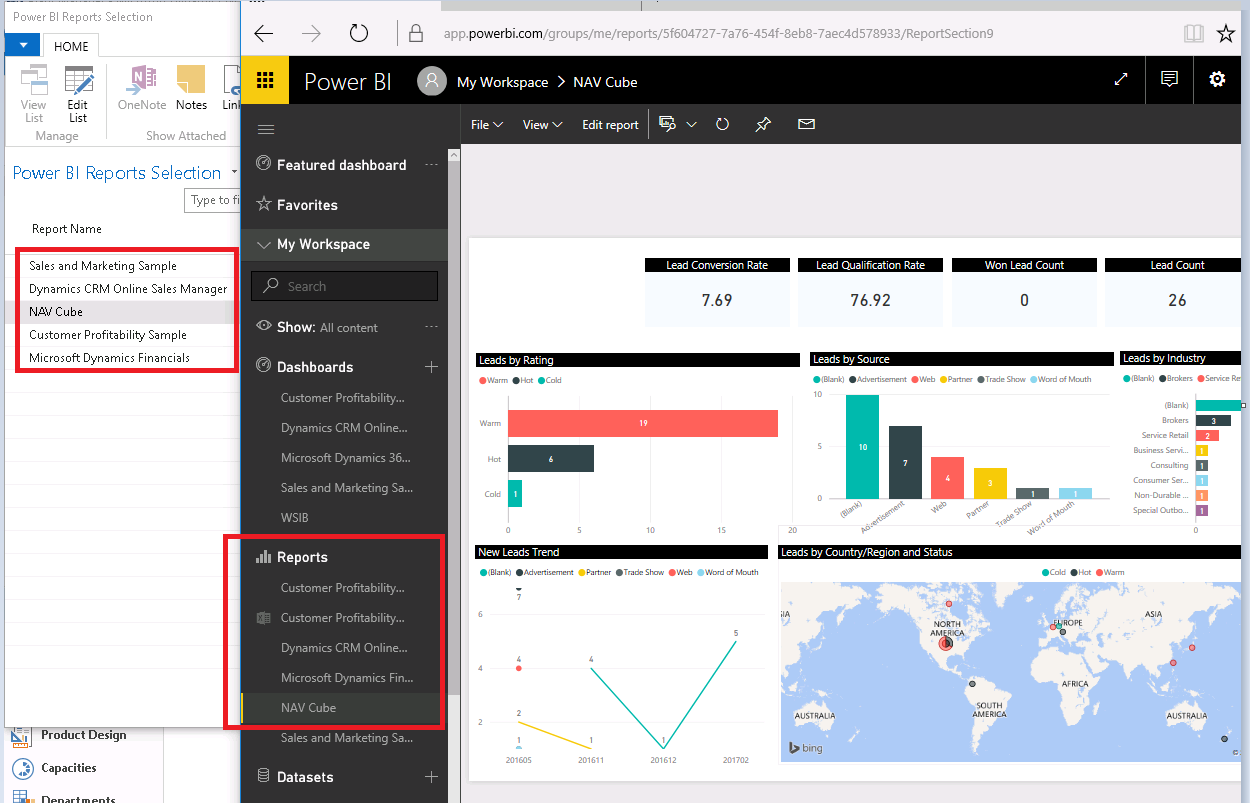
Power BI Reports at Your Fingertips - NAV 2017 will connect with any and all reports that are created in Power BI.
Below is an illustration of the reports that we have created in Power BI and have selected to be made available in NAV.
Here's a few links to more resources on the subject.
NAV 2017 New Features – Chart Part to Role Center
https://www.youtube.com/watch?v=tIM39oqMmEw
NAV 2017 – How to Connect Power BI
http://www.fajdiga.info/blog/2016/10/31/how-to-enable-microsoft-powerbi-in-nav-2017/
BI for Big Biz - April 19 Webinar
How many pebbles are in a truckload of gravel? How much water is in the ocean? Your ERP system generates so much information that, similar to the analogies above, it is beyond comprehension to calculate or analyze using traditional methods.
We know that valuable information waits to be discovered, but how do you find good customers that should be better customers, reliable vendors that could become critical partners or workflow barriers that impede operations and profits. This is where business intelligence software comes into play.
Today’s webinar is designed for companies with an interest in improving operations and growing their business using data and modern technology provided by Microsoft (Power BI, OLAP cubes, Visual Studio and Excel). Find out how the best run companies leverage their data with the business intelligence tools and techniques provided by Vox.
Agenda
- Battling Buzzwords: BI, Big Data, Data Discovery and Analytics
- BI and Predictive Analytics
- The Essential Elements of Analytics Driven Organizations
- Five Attributes of a Modern Robust Analytics Platform
- Seeing Solutions Holistically
- 100’s of Questions, 10’s of Discoveries, 1 Improvement
Cortana Analytics
I'm fairly certain that in 10 years from now there will only be 3 companies left in the world; Microsoft, Starbucks and Walmart.
But don't take my word for it, check out this video on predictive healthcare and check out what's new with Cortana Analytics in the link below.
https://www.microsoft.com/en-us/server-cloud/cortana-analytics-suite/overview.aspx
I'm about 8 hours or so into researching and trying to figure out is this machine learning. Many of the concepts I've had to open my old statistics book from university to understand.
In general though you need to
a) Have a problem
b) Have existing data
c) Transform and Normalize data
d) Load it into an algorithm so it can train
e) Setup scoring and indicators on probability
f) Publish out to a web-service.
This basically allows you to build an app for your industry.
https://youtu.be/-wVeHZNn8aU