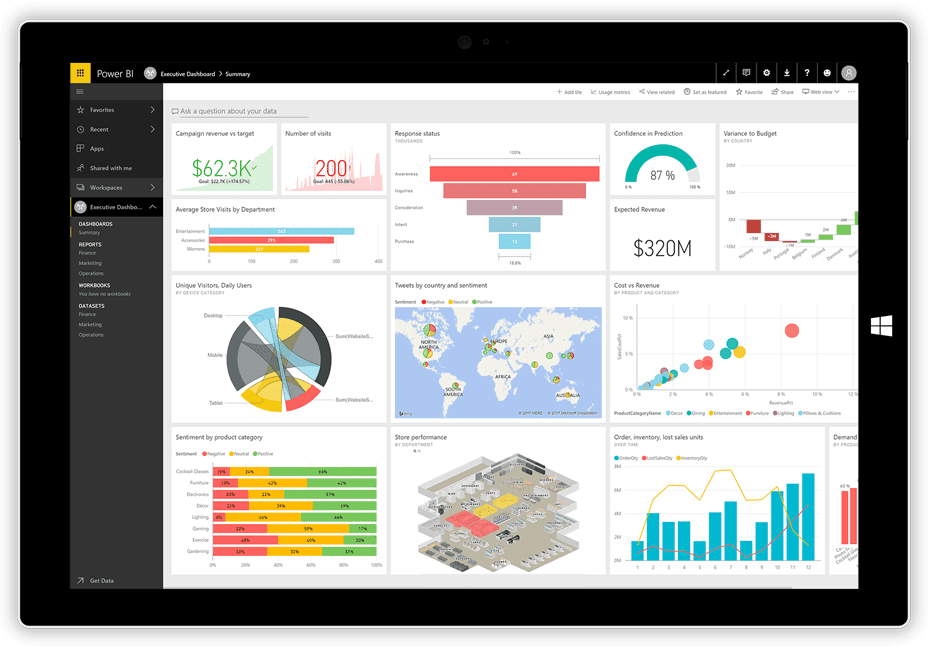
For many decades, Microsoft Excel has been the go-to reporting tool for businesses, but the latest Microsoft data visualization tool – Power BI offers robust analytics and reporting features for organizations.
Power BI offers faster experimentation with visualizations, advanced statistical functions and calculations across vast datasets, and ability to acquire answers on the fly through the quick recombination of fields; it is clear that Power BI delivers more exceptional insights than Excel.

Let’s take a look at some of the points you should shift reporting from Excel to Power BI:
1. Microsoft Power BI can access and store a vast amount of data
Power BI has impressive compression capabilities for Microsoft Excel and text/.csv files. It allows you to view, analyze and visualize large quantities of data that cannot be opened in Microsoft Excel.
Many computers fail to open up a 300-megabyte .csv, making analysis and reporting in Microsoft Excel a challenge. Then adding several smaller .csv files to data will be immensely tough to combine with your previous dataset and analysis.
Imagine having all your files stored, connected, fully analyzed, and using only 50mb. This now a reality with Power BI. Microsoft Power BBI uses robust compression algorithms to import and cache the data within the.PBIX file.
2. Incredible Cloud-based Features
After finishing your Power BI analysis, you need a way to publish and distribute your dashboards and reports.
In Excel, this would typically require emailing a large file or putting it in a shared drive or SharePoint portal, and letting everyone know the file has been updated. Now with Microsoft Power BI, this process has been entirely revolutionized.
You can now publish to the secure Microsoft hosted cloud service – Power BI Service and automate the refreshing of our underlying data. You just have to hit publish at the top right of the Power BI home ribbon.
3. Row Level Security
In Excel, adding Row Level Security (RLS) is very complicated. But with Power BI, it can be done easily. For example, you can use RLS to ensure that employees can only see data that is relevant to their branch/geography.
Adding RLS is simple, and the risk of others seeing data they shouldn’t from mailing around an Excel file is omitted.
4. Analyze Data Trends Easily
Analyzing data trends with Power BI is very easy. It has built-in time intelligence features which take only a few seconds to view vast amounts of data. You can view datasets by different dimensions and attributes, including date-time dimensions.
5. Amazing UX Features
With Power BI, you can make something visually appealing and neat with limited creativity or UX skills. Power BI’s drag-and-drop functionality, quick resizing, and copying and pasting features make it easy for those who are familiar with the Microsoft Office.
Conclusion
The future for Power BI is bright and shiny. Companies are speeding to incorporate this data visualization tool and to do away with tabular reports. With some great training, you too can be a Power BI superstar for your company! Join VOX ISM’s workshop on Introduction to Power BI on July 23 at Best Western, Mississauga to learn about this powerful tool.
Seats are limited for this workshop and they sell out fast, so early registration is strongly encouraged. There is no cost for this workshop.

