
With the massive amounts of data generated by your company, making sense of that data and sharing it with decision-makers can be challenging. In this blog, we covered the advantages of combining your existing Office investments with Power BI to work better and achieve more – Together. And how you can empower your team members to make better decisions with immersive reports and dashboards across Excel, Teams, SharePoint, and PowerPoint.
Advantages of using Power BI and Office together
- Get insights where you need them: You can get the data insights you need right inside the Office apps you use every day without changing applications.
- Help protect your Power BI data—across Office 365: you can safeguard your BI data with protection that persists when exported to other Office 365 apps formats, such as PowerPoint and Excel.
- Discover answers quickly through a familiar experience: If you know how to use Excel or PowerPoint, you can quickly get started to find insights fast.
Power BI insights + Office productivity
Microsoft Excel
By combining Excel with Power BI, you get comprehensive data analytics and visualization capabilities. With this integration, you can:
- Efficiently use Excel skills in Power BI through everyday experiences like data analysis expressions (DAX) and Power Query.
- See the correct data instantly in Power BI by automating your data refresh with a single click.
- View and interact with Microsoft Power BI datasets in Excel while maintaining interactivity features from Power BI.
- Get advanced custom visualization, modelling, and predictive capabilities for advanced analytics workflows.
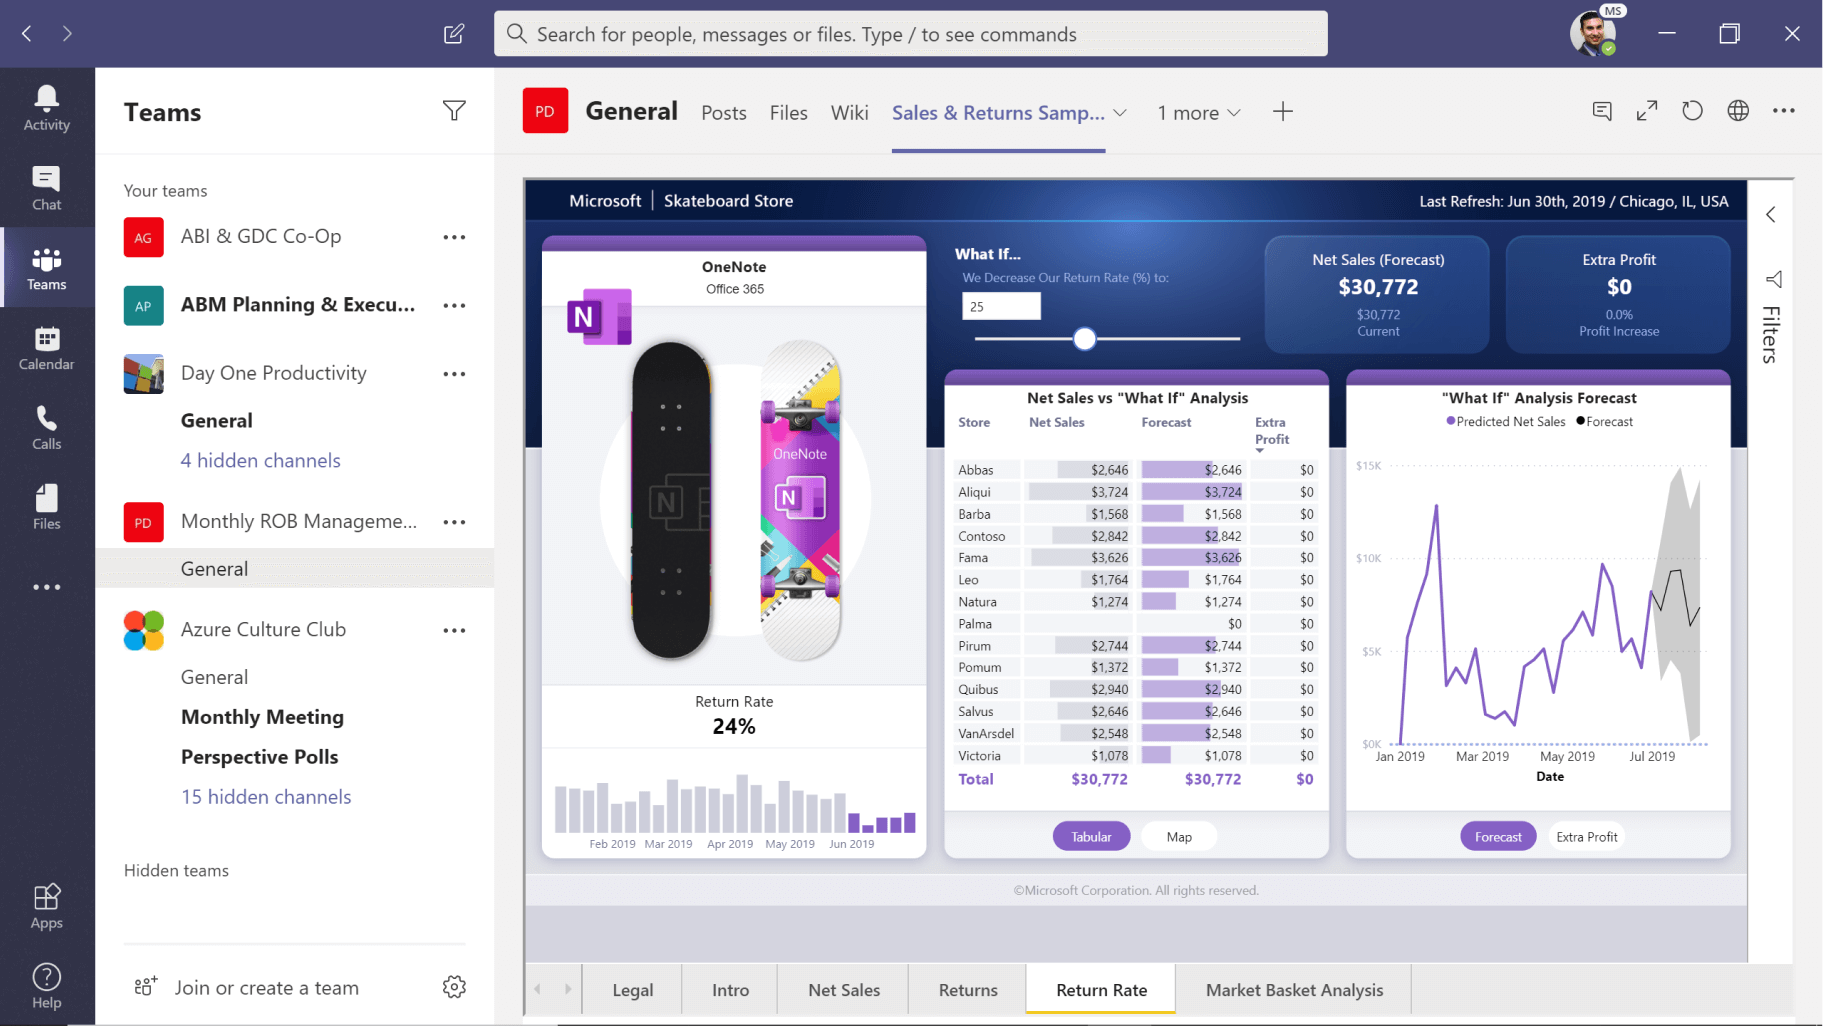
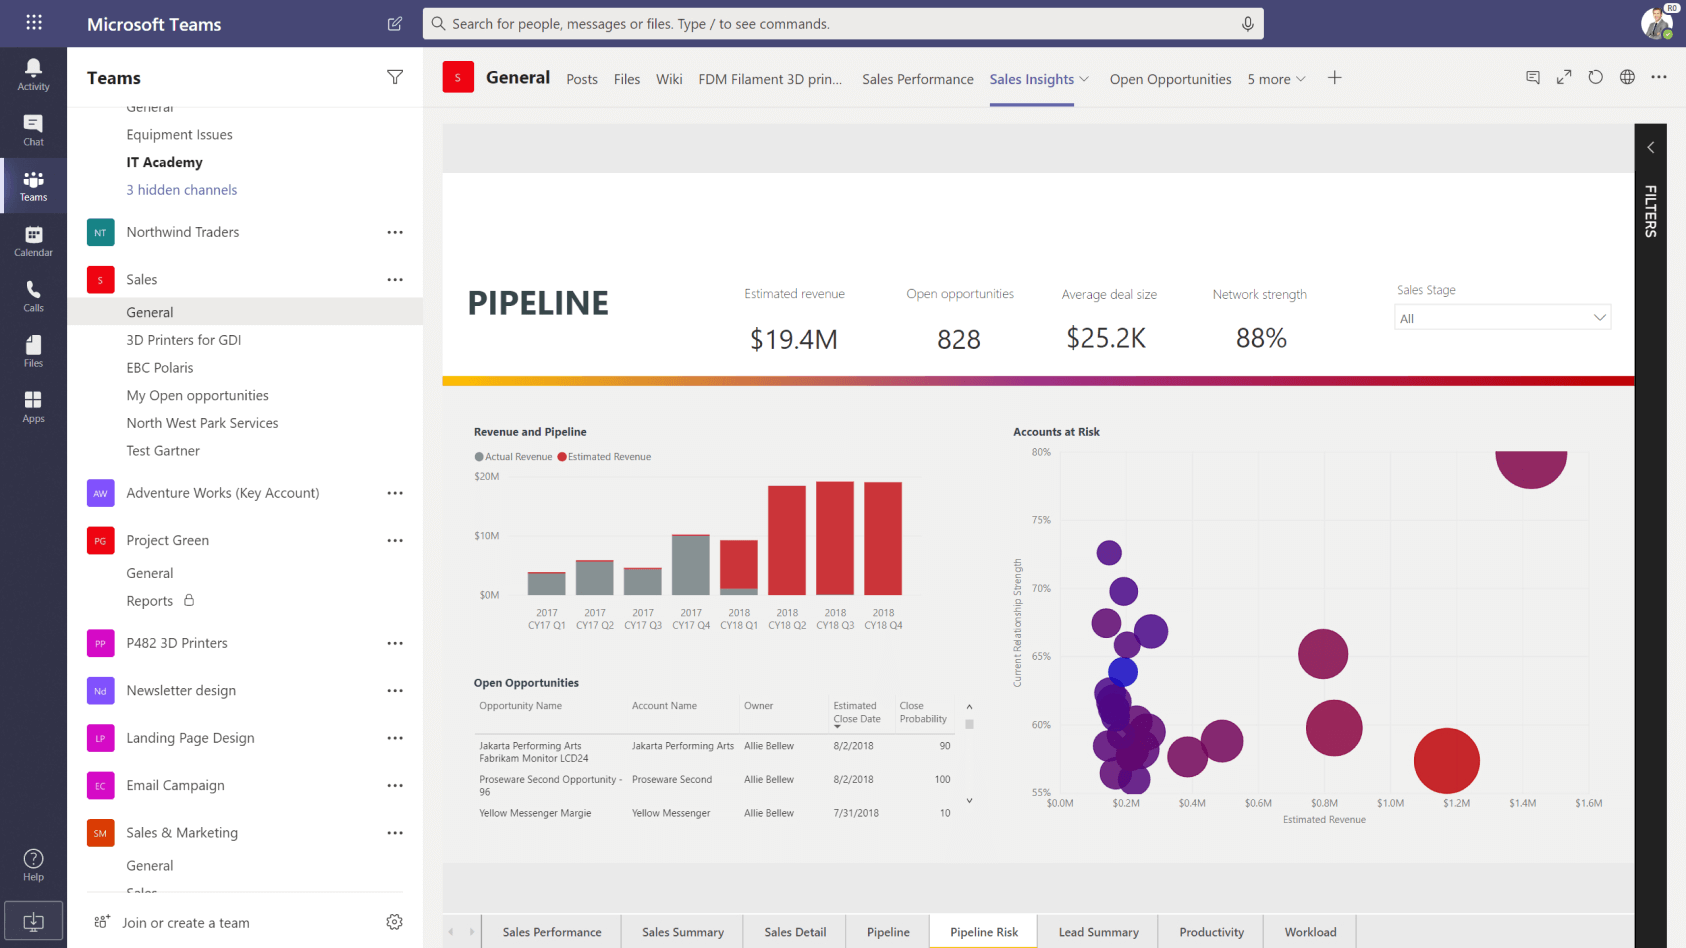
Microsoft Teams
You can make everyone in your company more productive by incorporating Teams with Power BI reporting. You can:
- Add interactive Power BI reports directly into conversations and Microsoft Teams to spend less time seeking them and more time using them to help team priorities.
- Give everyone in your team access to the data they need for a project by quickly incorporating Power BI visuals.
- Get to decisions accelerated by viewing and collaborating on data visualizations as a team.
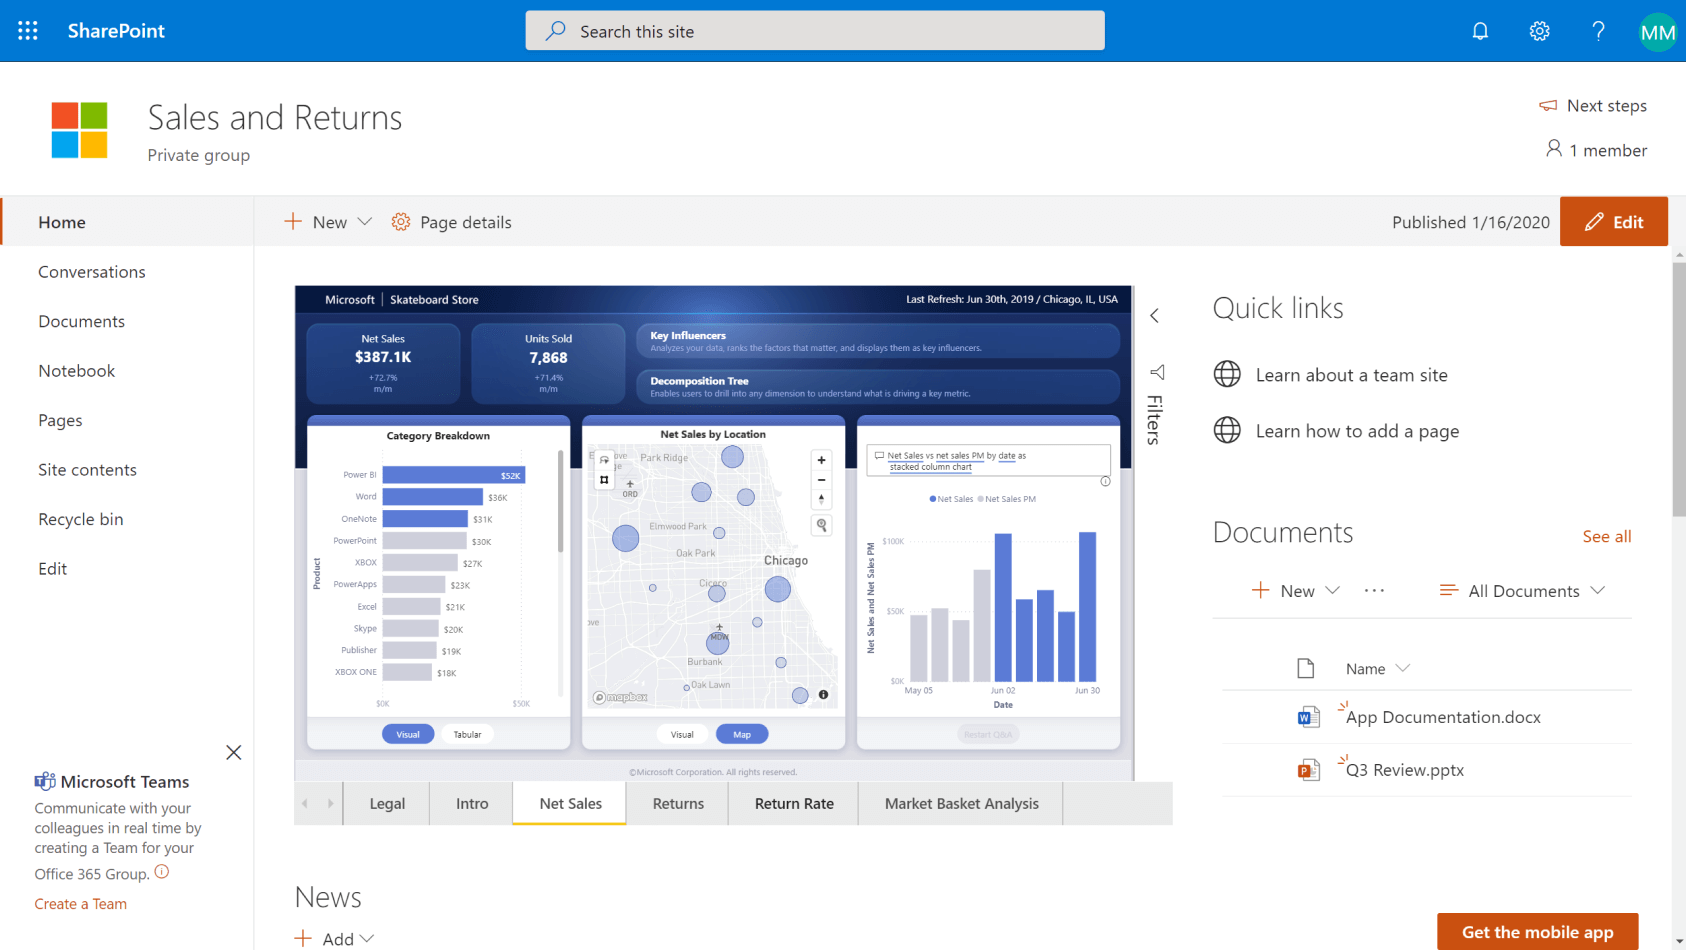
SharePoint
- You can embed interactive Power BI reports in SharePoint Online pages that everyone in your team can access.
- Stay updated on what’s crucial by surfacing data visualizations regularly accessed location.
- You can quickly customize the look of your BI reports to best suit everyone’s requirements.
- You no longer need to rely on local files that can get lost or damaged by storing BI reports in an online document library.
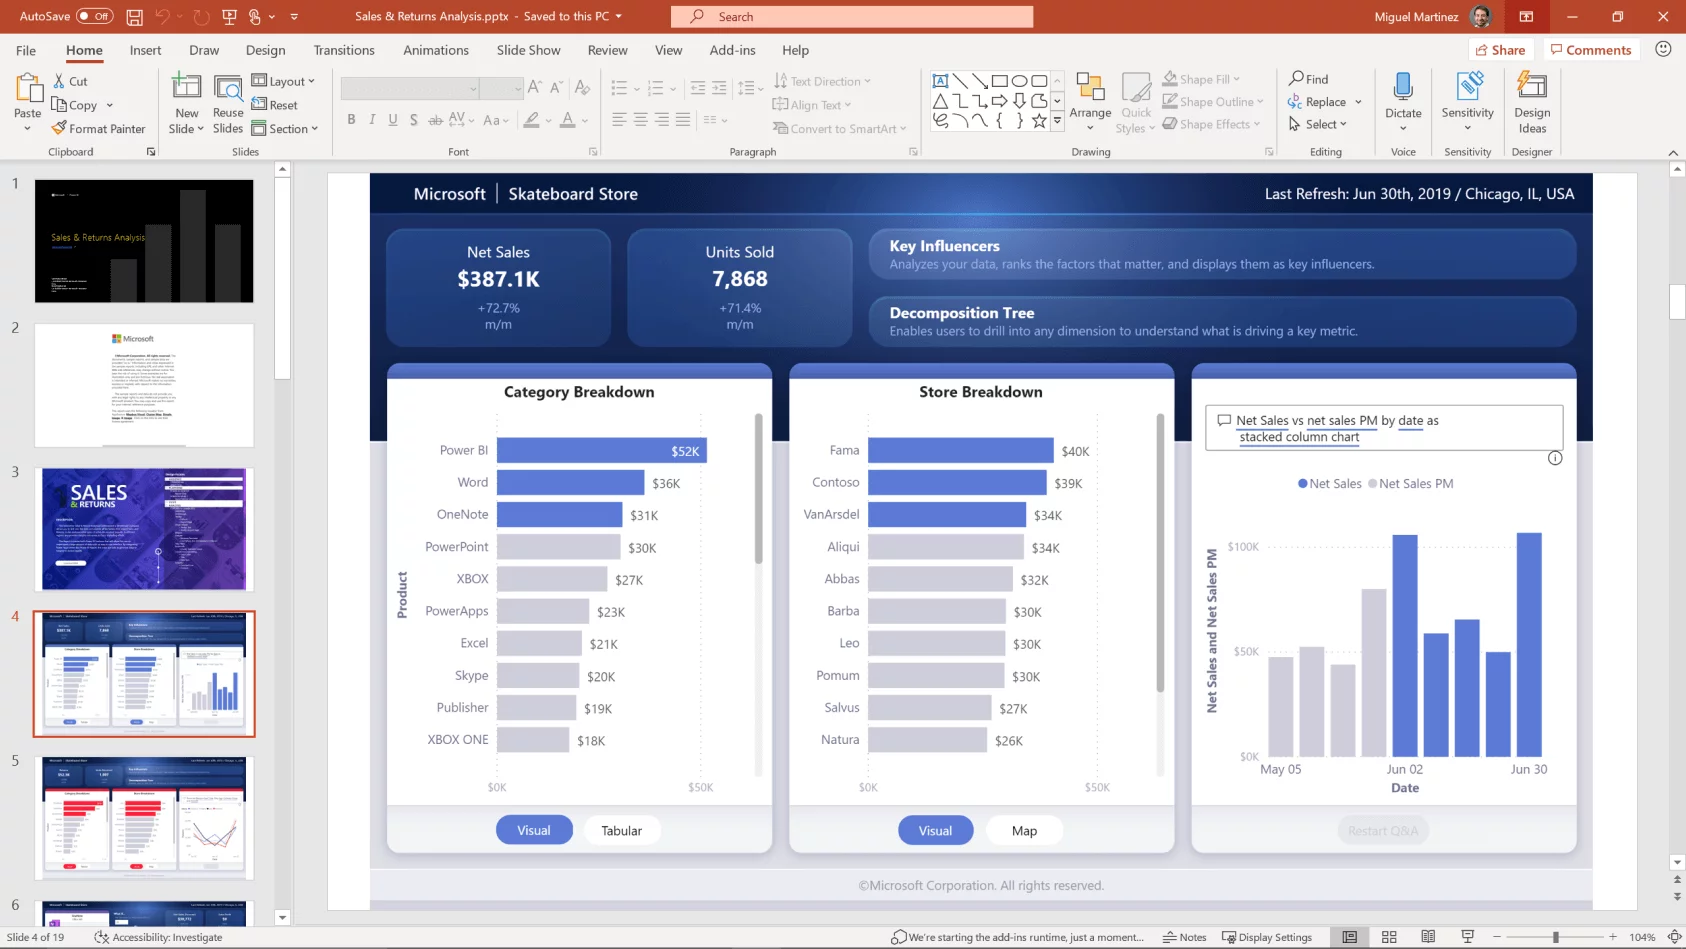
PowerPoint
- By exporting Microsoft Power BI reports to PowerPoint as high-resolution images, you can drive clarity and improve decision-making.
- It allows you to move seamlessly between your presentation and Power BI to dive deeper into analytics if required.
- You can export only the information you care most about—the filters and slicers settings you added are always preserved.
- You can create and publish Power BI reports using your existing PowerPoint skills.
Learn More
Discover more ways to make sense of all the data your organization generates. Join our exclusive Power BI Online Training Bootcamp from July 20 – July 22, 2021.