Data Warehouse
Executives hear the words ‘data-warehouse’, but what does it look like? What is it exactly?
“A relational database schema which stores historical data and metadata from an operational system or systems, in such a way as to facilitate the reporting and analysis of the data, aggregated to various levels”.
Below is a screen shot of a typical sales header table that references a customer posting group. In NAV you would find another table called customer posting group that would store a code, when you join the tables together through sql you can gain access to other areas of information. Pretty standard stuff if you’re a report writer.

But for speed and efficiency, most of the text based codes are translated to integers in a data warehouse and they are indexed. When you extract a sales invoice table from the data warehouse in sql it mostly returns 1’s and 0’s. Child tables like the customer posting group are indexed as well. Below is an illustration.

By itself, it is not that exciting, but what is interesting is that net change data gets added every day to the data warehouse from the main NAV or CRM system. This is called an incremental load and takes less than 5 minutes typically. Many years ago this ‘building’ process would take hours because all of the main tables would have been deleted and refreshed.
VoxISM’s data warehouse (as of August 2014) has information related to sales, cost of sales, inventory and opportunities, It is multi-company and merges data from both the CRM and NAV business systems. It was designed on SQL 2008 R2 and is scalable to SQL 2012 and works with NAV 2009 or CRM 4.0 and above.
Data Mart
What is a Data Mart? What does it look like? What is it exactly?
“According to the Inmon school of data warehousing, a dependent data mart is a logical subset (view) or a physical subset (extract) of a larger data warehouse, usually isolated for the need to have a special data model or schema (e.g., to restructure for OLAP). One of the benefits of the new Tabular mode in SSAS is that you can build that on top of a data warehouse instead of a data mart, saving time by not having to build a data mart.”
Basically it’s a fancy name for a sql view in the data warehouse, see below:

This allows you to extract a limited amount of information from the data warehouse and provided limit access to specific teams, ie Finance has their data mart, marketing has theirs, sales has theirs and so on. It is really just a subset of the data warehouse and typically used as the foundation to create an OLAP cube.
OLAP Cube
What is an OLAP Cube? What does it look like? What is it exactly?
According to Cybertec a cube can be considered a generalization of a three-dimensional spreadsheet. For example, a company might wish to summarize financial data by product, by time-period, and by city to compare actual and budget expenses. Product, time, city and scenario (actual and budget) are the data’s dimensions.[3]
This is the Dynamics NAV OLAP cube that is extracting and displaying information about sales invoices. It was created using analysis services, a component of sql server. Typically end users are not working here but in excel to build management reports.
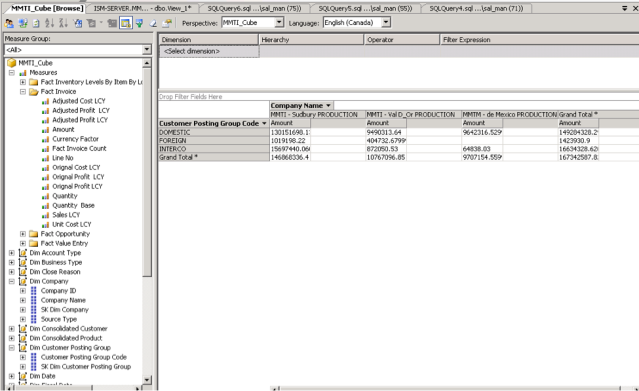
This is an example of creating a report using the OLAP cube. It is very similar to working with a view, except that it is able to extract and calculate data almost instantaneously. The views take time to load, require desktop horsepower and create huge excel files on the local PC. If your company has over 5 million invoice lines a data warehouse and OLAP cube will reduce the strain on the production database and make analysis extremely fast.
