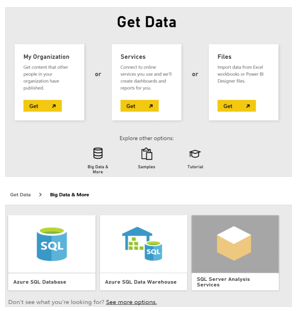
Overview of data sources in the Power BI service
You can choose from one of the following types of data sources
- My Organization
- Services
- Files
- Big Data & More
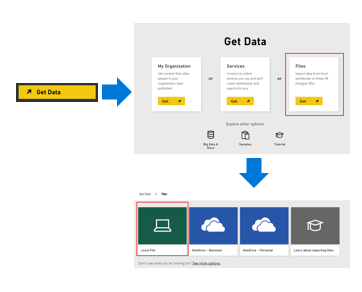
Step 1: Get Data
1.Click the plus sign next to Dashboards to create a new dashboard
2.Give your dashboard a name and press Enter to create it
3.Click the Get data icon
4.Select the Files Option
5.Notice that the Excel workbook can be sourced from a local computer, or from a OneDrive location
6.To upload a workbook from the local computer, click Local File and navigate to the excel file.
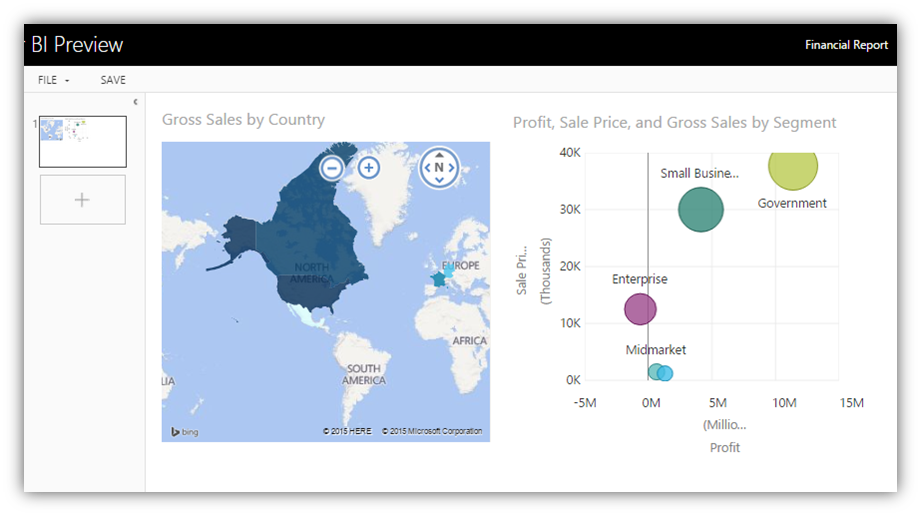
Step 2: Create report and build visualizations
1.Click the Financial Sample.xlsx tile in the Dashboards
2.Lets visualize Gross Sales by Country as a map
3.Lets visualize Profit, Sales Price, and Gross Sales by Segment as scatter chart
4.Save the report as Financial Report
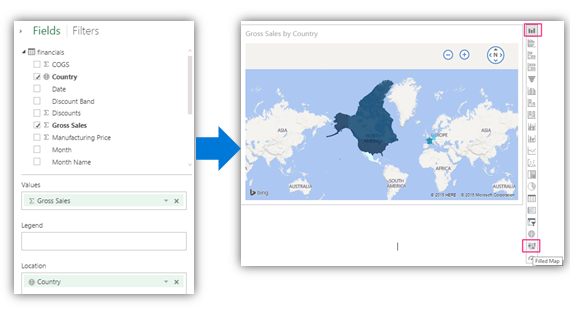
Step 2: Create report and build visualizations (Contd.)
Lets visualize Gross Sales by Country as a map
1.From the Fields list, select Country and Gross Sales
2.Power BI will try to match the right visualization for the selected fields. You will see a map displayed, with Country being shown as Location, and Gross Sales being shown as Values
3.Using the ‘Change visualization type’, change the visualization to Filled Map
Step 2: Create report and build visualizations (Contd.)
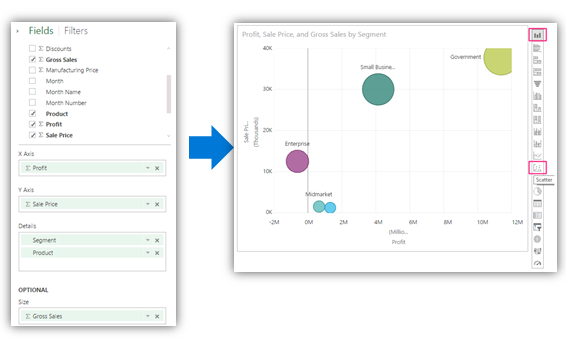
Lets visualize Profit, Sales Price, and Gross Sales by Segment as scatter chart
1.From the Fields list, select Profit, and Sales Price
2.Using the ‘Change visualization type’, change the visualization to Scatter Chart
3.From the Fields list drag and drop the fields Segment and Product(drill down) to the Details area
4.From the Fields list drag and drop the field Gross Sales to the Size area
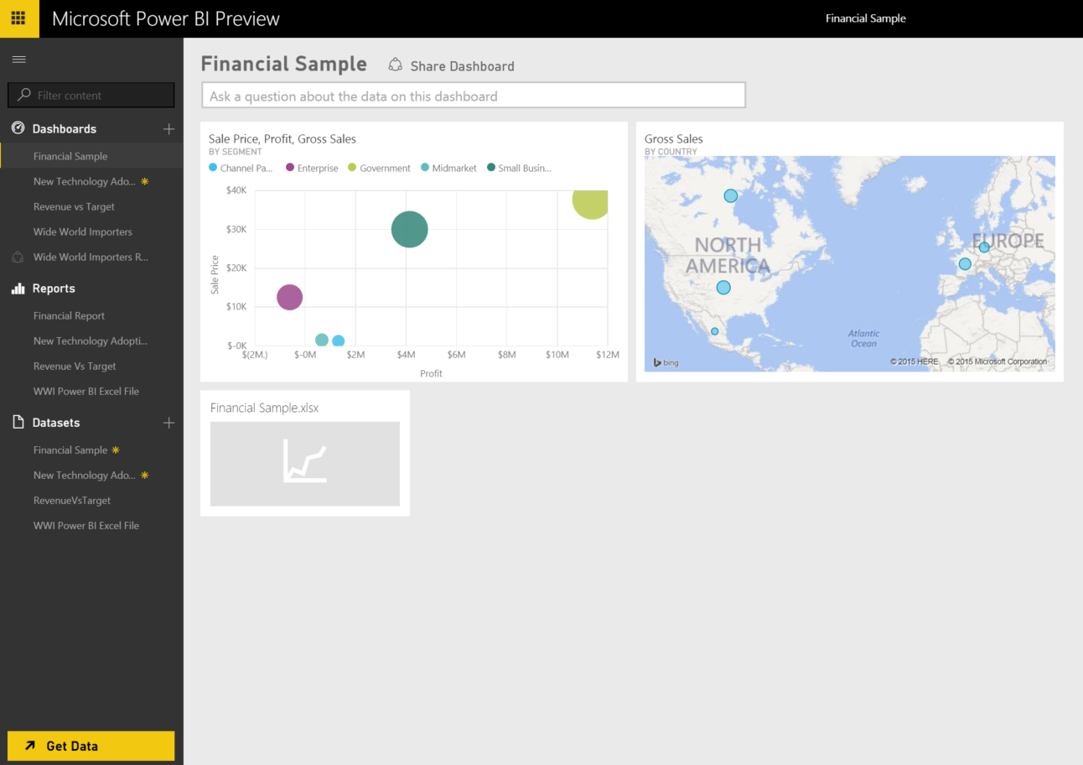
Step 3: Pin visualizations to dashboard
1.Click the Financial Report in the ‘Reports’ section of the navigation pane
2.Pin the following visualizations as show in the image
a.Pin Profit, Sales Price, and Gross Sales by Segment to the dashboard
b.Go back to the dashboard; ask question gross sales by country in Q&A text box. Pin the resulting map to the dashboard
https://support.powerbi.com/knowledgebase/topics/63037-getting-startedhttps://support.powerbi.com/knowledgebase/topics/63369-get-datahttps://support.powerbi.com/knowledgebase/articles/474669