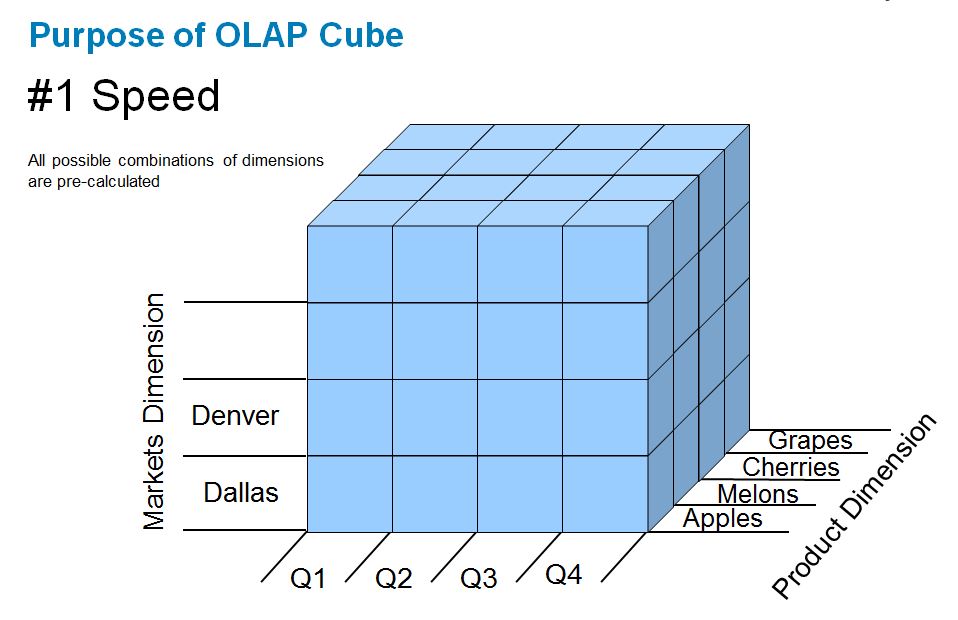
A data warehouse is a database used for reporting and data analysis (aka business intelligence) An OLAP cube is a multidimensional dataset built from the data warehouse.

This diagram represents how data can be extracted from more than 1 data source, transformed or summarized, archived into the data warehouse on a daily basis for comparisons, then converted from 2 dimensional tables into an OLAP cube which can be accessed through excel or SSRS.

VoxISM is now offering a data warehouse for both Dynamics NAV and CRM. Below is an example of the NAV posted sales invoice table, but you’ll notice it looks nothing like what you would see in NAV. The fields have been normalized and converted into numbers and codes, which are indexed for performance and set the stage for the OLAP cube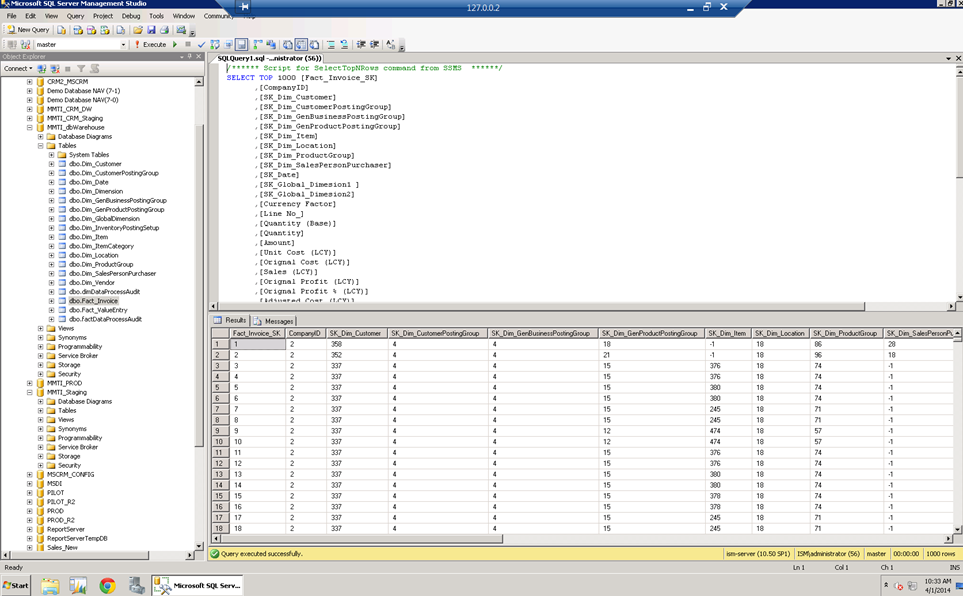
In our previous releases we were connecting directly to the database and tables, creating views (similar to the diagram below) that would join several tables together. In many cases we needed to create unions of tables or connect to child tables that would draw out additional information into a very large 2 dimensional dataset. When this dataset was exported to excel, we essentially dumped out the entire contents of the database and created pivot tables.

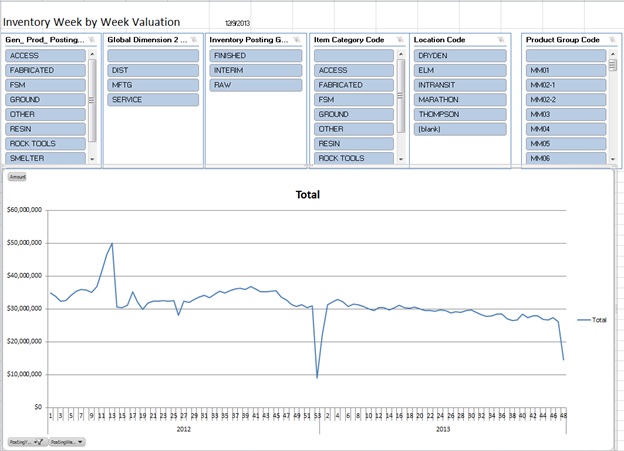
After you convert the 2D table into a pivot table (3d), the slicers in excel 2010 allows you to quickly filter the large dataset. In the example below the field for ‘Region’ might have referenced a million times in the original dataset and the slicer simply sorts through and finds the distinct (unique) values. The more slicers you add and the larger the dataset, the longer it would take to compute the results.

The OLAP cube eliminates this process by storing the data in a snowflake schema. It contains 1 core table with the essentials (FACT TABLE) then connects with indexes to the child tables called DIMENSION which become your slicers later on in excel.

This is an example of what the OLAP cube looks like on the analysis server
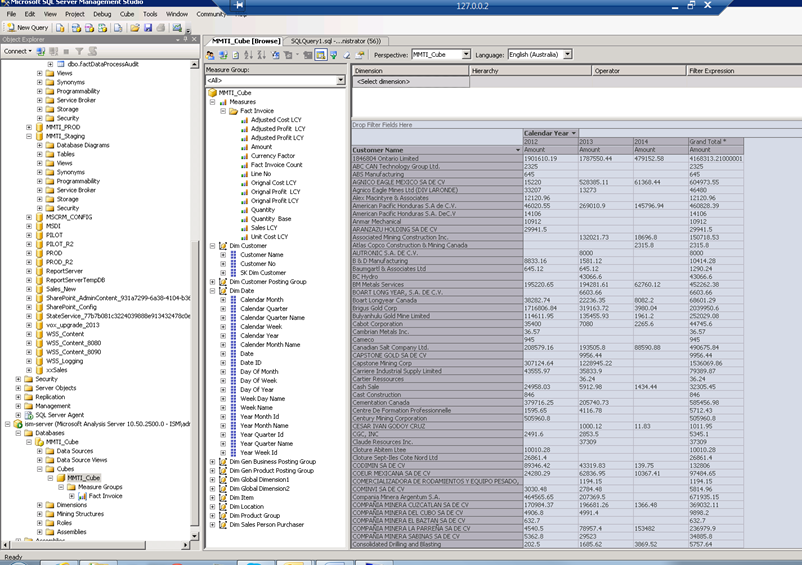
An OLAP cube really doesn’t look much different than our original view based cubes, but as the database starts to grow you might see performance issues in reporting, have a need to compare historical performance or need to merge other external data (like point of sale) for analytical purposes.
At the end of the day, do you need an OLAP cube? Maybe not today, but I believe that this sets the foundation for the future of business intelligence. You’ll hear on the news or see in the stores books on BIG DATA (read analyzing social media). This will be the topic of my one of next blogs and how you can use Microsoft technology to convert discussions on-line to opportunities.
Hope this helps to explain some of the mysteries of BI
Mike Fontaine
April 3 2014