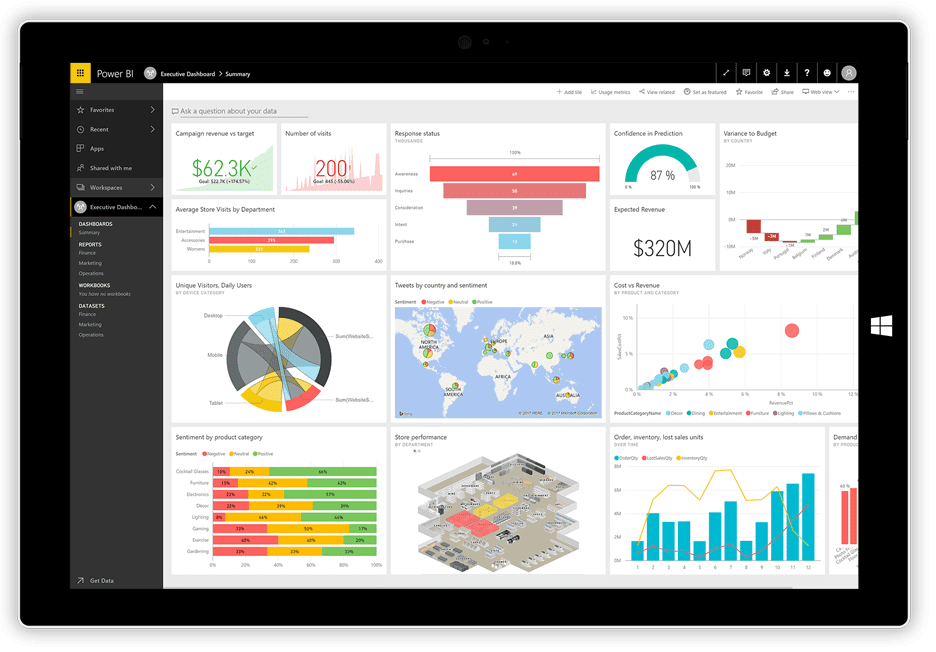
Microsoft Power BI is a modern tool for business analytics. It empowers users with real-time insight into what is happening. With Power BI, you can create personalized dashboards “in no time” and find answers to the most important questions for your business. Power BI provides cloud-based BI services along with desktop version. Microsoft releases new features and updates for Power BI very frequently to improve performance.
Just in 2018 alone, over 150 features were released in terms of analytics, modelling, custom visualizations, data connectivity, data preparation and reporting. Here are the top five features picked by Vox ISM’s Power BI team for 2018.
- Report page tooltips
It gives user the flexibility to customize the tooltips when hovering over other visuals. Think of it as a drill down without having to actually drill down. If you hover over a data point on a line graph for example you can see a whole new report about that particular data snippet.
(https://docs.microsoft.com/en-us/power-bi/desktop-tooltips)
- Web by example
You can consistently extract data directly from web pages with sample selections to target the larger data set you wish to extract. Typically this was a difficult task due to diversity in website design, but with this tool you can still get your industry trends/insights from the web.
- Composite models + aggregations
New aggregation feature allows to cache the data at the aggregated level and gives users a great user experience with huge datasets. It provides instantaneous insights with almost six trillion rows.
(https://docs.microsoft.com/en-us/power-bi/desktop-aggregations)
- Expand + collapse
This feature allows users to drill down the levels and it is one of the most requested features
(https://docs.microsoft.com/en-gb/power-bi/visuals/desktop-matrix-visual)
- New filter experience
You can format, customize, hide and lock the filters. Now you have the ability to see what filters or slicers are applied to the report.
(https://docs.microsoft.com/en-us/power-bi/power-bi-report-filter-preview)
Apart from these eminent features, Microsoft released various Accessibility features like add filters to the context menu, ability to see hex values if you hover over the colours, keyboard shortcut dialogue so that you don’t have to remember shortcuts. Overall 2018 was a good year in terms of features, but we look forward to new features related to Business intelligence and intuitive insights in 2019.
Interested to know more about Microsoft Power BI:
Join us for an exclusive webinar on January 16 to learn more about Vox ISM Industry Specific Power BI solution – MARS – Management Analytics Reporting Suite. Click here to register.
Blog post by Emilia Arkadyev and Vasudha Solanki.

Emilia Arkadyev- Solutions Architect, Development Manager
Emilia has been with Vox ISM for over 11 years. Her current role with Vox ISM is focused on solution architecture, business intelligence, integrations and data management. Emma has 25 years of experience and the successful completion of hundreds of projects.
Vasudha Solanki- Project Manager
Vasudha is a Project Manager at Vox ISM, her current role is focused on Client relationship building and successful project delivery. She will be the active communication link between the customer and all project stakeholders.